In this quick video I demonstrate how we can use pressure data from the transportation monitoring example covered in my post "What Really Happens to Your Package During Transportation" to approximate the truck's location.
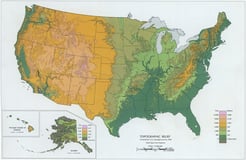
Going into the test I wasn't expecting to be particularly interested in either temperature or pressure; I was more focused on vibration. But when I had a look the pressure data I noticed something pretty interesting. It shows the elevation change and corresponding drop in pressure when the truck was driving through the middle of the country! From the UPS tracking information, the box traveled through Spokane on the way out to Seattle; and on the way back it went through Portland. This means that it likely traveled through the more northern portion of the Rocky Mountain range on the way out which is less in elevation as shown in Figure 1.
Never Miss a Post - Subscribe Today!
✉ Click For Our Latest Sensing Tips
GALLERY - Click to enlarge images


If we calculate the elevation from the pressure data (see Mide's pressure-altitude calculator for more information - Note: enDAQ is a division of Mide), as shown in Figure 2, you can clearly see the much larger spike in elevation for the second half of the shipment. This matches up nicely with the topographical map of the US and assumed route, pretty cool!
Conclusion
Thank you for joining me in my first foray into video blogging, hopefully you enjoyed it! If you liked what I covered, please subscribe to our engineering blog for future discussions, and let me know if there is anything in particular you would like me to post about.
I also encourage you to download the data (click here data download page) and do your own analysis.
Lastly, check out our free 70 page Shock & Vibration Testing Overview eBook. In there are some examples, background, and a ton of links to where you can learn more. And as always, don't hesitate to reach out to us if you have any questions!
Related Posts:
- Strain Gauges: How They Work, Applications, and Types
- Thermocouples: Functions, Types, Selection, and Application
- Light Sensors: Units, Uses, and How They Work
For more on this topic, visit our dedicated Environmental Sensors resource page. There you’ll find case studies, webinars, software, and products focused on your environmental testing and analysis needs.
