Have you ever boarded a train in a different country, region, or state and thought, “WOW, this is so much better than what we have back home!”? Well, sometimes the grass is greener because, chances are, the rail system you’re riding may very well be far superior to the one you avoid at home. Between breakdowns, slow or reduced service, and track and signaling issues, rail systems worldwide face a number of costly inconveniences that impact everyone from the individual rider to the companies that manage them.
Though rail has been notoriously slow to change and adapt, increasing demand for higher speed and reliable transportation that connects cities and countries and improves the overall quality of moving people efficiently, safely, and quickly around their communities is forcing the rail industry to start modernizing. This can mean anything from integrating autonomous trains to using insights to establish a predictive maintenance system that saves governments, municipalities, and rail companies time and money.
Insights from something as simple as affixing a vibration sensor to a bridge and collecting data on one passing train can start the process of building up the data needed to implement a condition-monitoring system that detects changes so you can make fixes before breakdowns happen.
In this post, I’ll analyze the data of an MBTA commuter rail train passing over a bridge. We’ll walk through the setup of the test, the testing environment, and why I chose this sensor to record with, and then we’ll walk through the analysis and how I established GRMS and peak frequency of a train passing over a bridge.
There’s also a video tutorial you can watch and some free software downloads to get you going. I’ve also provided the data files, so feel free to download those as well!
- Video Tutorial: Train Passing Over a Bridge
- How to Configure and Setup Your Accelerometer for Rail Testing
- Why I Chose This Accelerometer for Rail Testing
- What We Know About the Structure We're Testing
- What I Want to Learn About the Vibration Environment
- Analyzing the Rail Data
- Conclusion & Additional Resources
Analysis Video Tutorial: Train Over a Bridge
This blog post is based on a video we did that’s part of a series called Guess the Vibe. You can check out more of our Guess the Vibe videos and other tutorials in our Resource Center. There’s a lot of good content in there, including step-by-step video guides, to help you with your analysis.
And, if there’s a tutorial you’d like to see, just let us know in the comments or contact us. We’d love to hear from you.

How to Configure and Setup Your Accelerometer for Rail Testing
Using one of our S-Series magnetic, waterproof enclosures, I affixed a S3-E100D40 enDAQ sensor with a 100g piezoelectric accelerometer to an underpass of the Lowell Line of the MBTA Commuter Rail. All of our waterproof cases come equipped with two rectangular mounting magnets each with a 54.1 lb pulling force, so I knew I could affix and remove the sensor easily and also know that it would be secure.
As you can see in the gif below, the biggest obstacle to setting up my test is the distance between Steve and the bridge. A quick jump up, and we’re ready to go.
For this test, I configured my device (100g accelerometer) in enDAQ Lab as follows:
- Sample rate: 20,000 Hz
- Low pass filter: 5,000 Hz
I also had all the other sensors turned on (pressure, temperature, and relative humidity) including the magnetometer and rotation sensor.
Why I Chose This Accelerometer for Rail Testing
When you’re testing on rail, you want to consider a few things about your environment before committing to a sensor. Though this particular test was quick – I only needed to wait for one train to go by and had a rough idea of when it would be happening – proper rail testing likely requires a number of sensors recording data over a long period of time and in harsh environments.
I chose the S3-E100D40 because I’m looking to characterize a vibration environment. The trouble when trying to select an accelerometer to characterize an environment is that… knowing which accelerometer is best is only fully possible once you know the environment! But here’s what I did know:
- Expected the frequency content to be mostly in the hundreds of Hertz
- If it is going to be >300 Hz, I can’t use the DC capacitive type; I’ll need either piezoelectric or piezoresistive
- If it is going to be over 1,000 Hz, I’ll need an aluminum enclosure - I expected to be below that, so polycarbonate would be fine!
- Mostly concerned with vibration – selected piezoelectric
- Piezoresistive would be better for shock
- Peak acceleration wasn’t expected to be too high, I thought maybe 10g but I wasn’t certain so I erred on the side of having a wider measurement range
- I was going to be putting it inside our rugged waterproof enclosure so the case material itself wasn’t super important from a rugged perspective
For an overview of a range of great vibration sensors, take a look at Rating My Top 11 Vibration Data Loggers post or, if you need a Wi-Fi enabled system that allows for more condition-based maintenance and monitoring, check out our Top 9 Accurate Wireless Vibration Monitoring Systems.
What We Know About the Structure We're Testing
The MBTA Commuter Rail track we collected our data from has been around for awhile – since about 1850. Though there have been updates, expansions, closures, and morphing usages over the years (primarily freight in its first 50 years), the path and curvature of the track has remained.
The speed limit on the track is asymmetrical. If a train is headed northbound, the track supports up to 70 mph (110 km/h). If the train is going southbound, the maximum speed is 60 mph (97 km/h). Both top speeds are impacted by curvature and other speed restrictions at various crossings on the line. At this underpass where the track is straight, maximum or near maximum speeds could possibly be achieved in this zone. This train was heading north and so could reach speeds of 70 mph (Source: Boston to Montreal High-Speed Rail Planning & Feasibility Study Phase 1: Final Report).
The MBTA trains are push-pull trains that are powered by diesel locomotives each with a control car at the opposite end. The train going over the bridge that we tested had four coaches.
The bridge itself is from 1850! Due to its low clearance, a number of trucks have struck it and been stuck under it over the years.
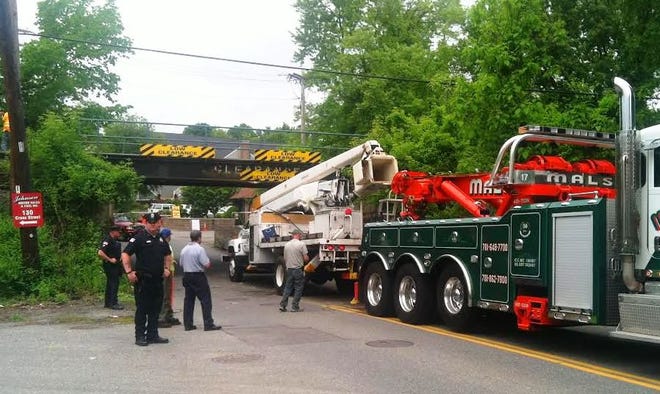
A bucket truck trapped underneath the bridge (Source: Wicked Local)
What I Want to Learn About the Vibration Environment
I want to characterize the vibration environment, and to do that you use a power spectral density! Another way to more simply define the environment is to provide the overall RMS and the peak frequency – so let’s do all 3!
Analyzing the Rail Data
What is the GRMS & Peak Frequency of a train passing over a bridge?
In the Guess the Vibe video, we asked viewers to take a guess at the GRMS and the peak frequency (Hz). So let’s start with the answers and then we’ll go over how we did the analysis.
So here is the power spectral density (PSD) of the train going over the bridge.

I was pleasantly surprised about how broadband the vibration is across from about 20 Hz to about 1000 Hz. It’s pretty steady, but there is definitely a peak at 23 Hz in the y-axis which is going in the direction of the road. The acceleration amplitude measured by GRMS is about 0.9 in the y-axis.
So if you guessed:
- gRMS: 0.9
- Peak Frequency (Hz): 23 Hz
you got it right!
How We Conducted the Analysis
Below shows the train going over the bridge in the main accelerometer:

The secondary accelerometer shows a similar profile as it passed:

Interestingly, as the train passed, the magnetometer indicated that the magnetic field somehow swapped. I’m not completely sure what this is showing or if something was wrong with the magnetometer, but something happened there that is interesting.

Now that I have the acceleration data, I can calculate a PSD using a 1 Hz frequency bin width. Below is this PSD in an interactive form, enjoy!
Again, the y-axis is the most severe (pictured in purple). There’s definitely a peak here at 23 Hz, but there are a variety of peaks throughout ranging from 20 Hz to 1000 Hz and then it starts trailing off. Again, the y-axis is in the direction of the road.
The z-axis, which I thought would be the most severe (pictured in green), wasn’t. It was the second most severe. It had a similar profile, but in the z-axis it actually has a peak more pronounced at around 1000 Hz.
Cleaning the PSD
As you’ve probably noticed, this is a pretty messy looking PSD. To fix this, I converted to octave format, which makes it a bit cleaner while maintaining that same GRMS throughout the frequency range. But again, in this plot you have a peak in that lower 20-30 Hz range.

RMS from the PSD
One of the nice things about power spectral densities is that you can compute the RMS directly from it. Below is the cumulative RMS across frequency which is a helpful way of understanding which frequency ranges contribute more significantly to the RMS acceleration levels. You'll see that the RMS value is about 0.95 gRMS (it's an interactive plot!).
We can also use this to more coarsely divide the frequency content by RMS and view it as a bar chart, we notice that most of the vibration amplitude comes from the frequency ranges of 300 to 1400 Hz.

Data from Mounting the Accelerometer
One last thing I want to show you is what happened when I was mounting the device to the bottom of the bridge. You can see the massive shock event very clearly! That’s from when the magnets connected to the steel beam.
.png?width=720&name=MicrosoftTeams-image%20(8).png)
But what’s interesting in this data file is, that even though the device was inside a waterproof enclosure, you can see the pressure change when it went from in my hands to mounting it on the bridge just five feet above.
.png?width=720&name=MicrosoftTeams-image%20(9).png)
The magnetic field also alters when it comes in contact with that steel beam.
.png?width=720&name=MicrosoftTeams-image%20(10).png)
I've written an entire blog post on the importance of accelerometer mounting that talks about how mounting types and methods influence the resonant frequency of the accelerometer. You can read all about the different mounting techniques here: Accelerometer Mounting Best Practices for Vibration Measurement
Conclusion & Additional Resources
So there you have it, a quick rundown of how I analyzed some vibration data of a train passing over a bridge. If you want to dive in yourself (and I encourage you to do this!) check out the Google Colab that contains all the Python code used to generate these plots. The raw recording file generated by the enDAQ sensor can be downloaded here or you can download a CSV of just the acceleration data.
I hope you found this tutorial and the software and data files useful. Please don’t hesitate to leave a comment or contact us directly with any questions you may have on this topic or others. We are here to help you with all your testing needs!
Related Posts:
- Why the Power Spectral Density (PSD) Is the Gold Standard of Vibration Analysis
- How to Develop a Vibration Test Standard PSD from Experimental Data
- Ever Wonder What the Resonance of a Bridge Is?
For more on this topic, visit our dedicated Vibration Loggers & Vibration Sensors resource page. There you’ll find more blog posts, case studies, webinars, software, and products focused on your vibration testing and analysis needs.