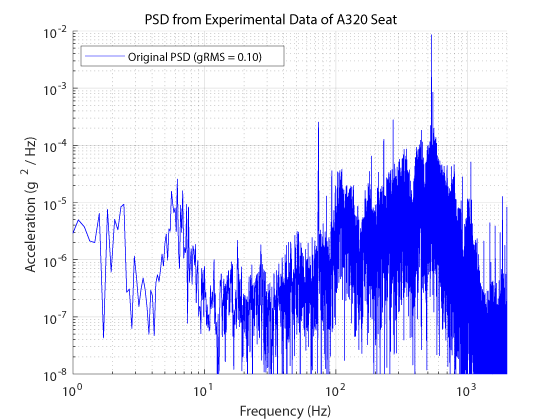
Have you ever seen a power spectral density (PSD) that has so many break points that it just looks like a shaded mess? How are those PSDs we see in environmental test standards developed that look so clean and simple?
How do we go from this:
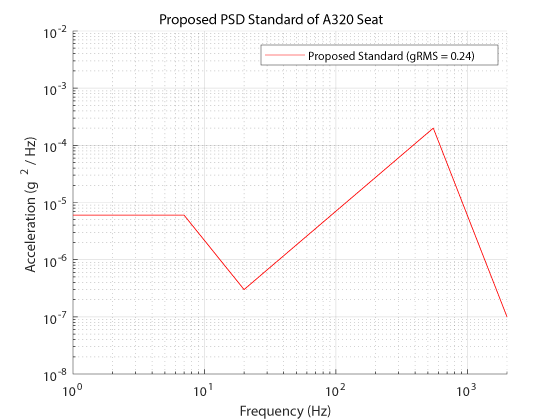
To this (while being true to real environment):
In this article I'll show you how to do this with any data set you have with a truly free software tool: the VibrationData Toolbox. We'll go through the process with using two real examples (one from a commercial flight, another from inside a Ford F-150), with this data available for download. The specific topics we'll cover include:
- Acquiring the Experimental Vibration Data
- Calculating the PSD
- Converting the PSD to Octave Format
- Estimating a Test Standard
- Checking the Standard using a Vibration Response Spectrum
- Time Series Synthesis off the PSD
- Conclusion and Additional Resources
By the end of the article you will be able to know how to take environmental vibration data and develop vibration test standards to use to inform your design decisions and then to replicate the environment in the lab.

Acquiring the Experimental Vibration Data
In both examples I used an enDAQ sensor to acquire the vibration data. These are products we sell, so I won't spend too much time on highlighting them. I used them because of their portability to go into the field and get real data. And again, you can download this data to follow along with. There are two IDE files (raw data files from the enDAQ unit with data from many different sensors including the accelerometers, temperature, pressure, humidity, orientation, and light), two CSV files for the area of interest we're exploring, a few text files of the PSD test standards that we later develop, and a folder of all these sweet plots in a higher resolution to use wherever!
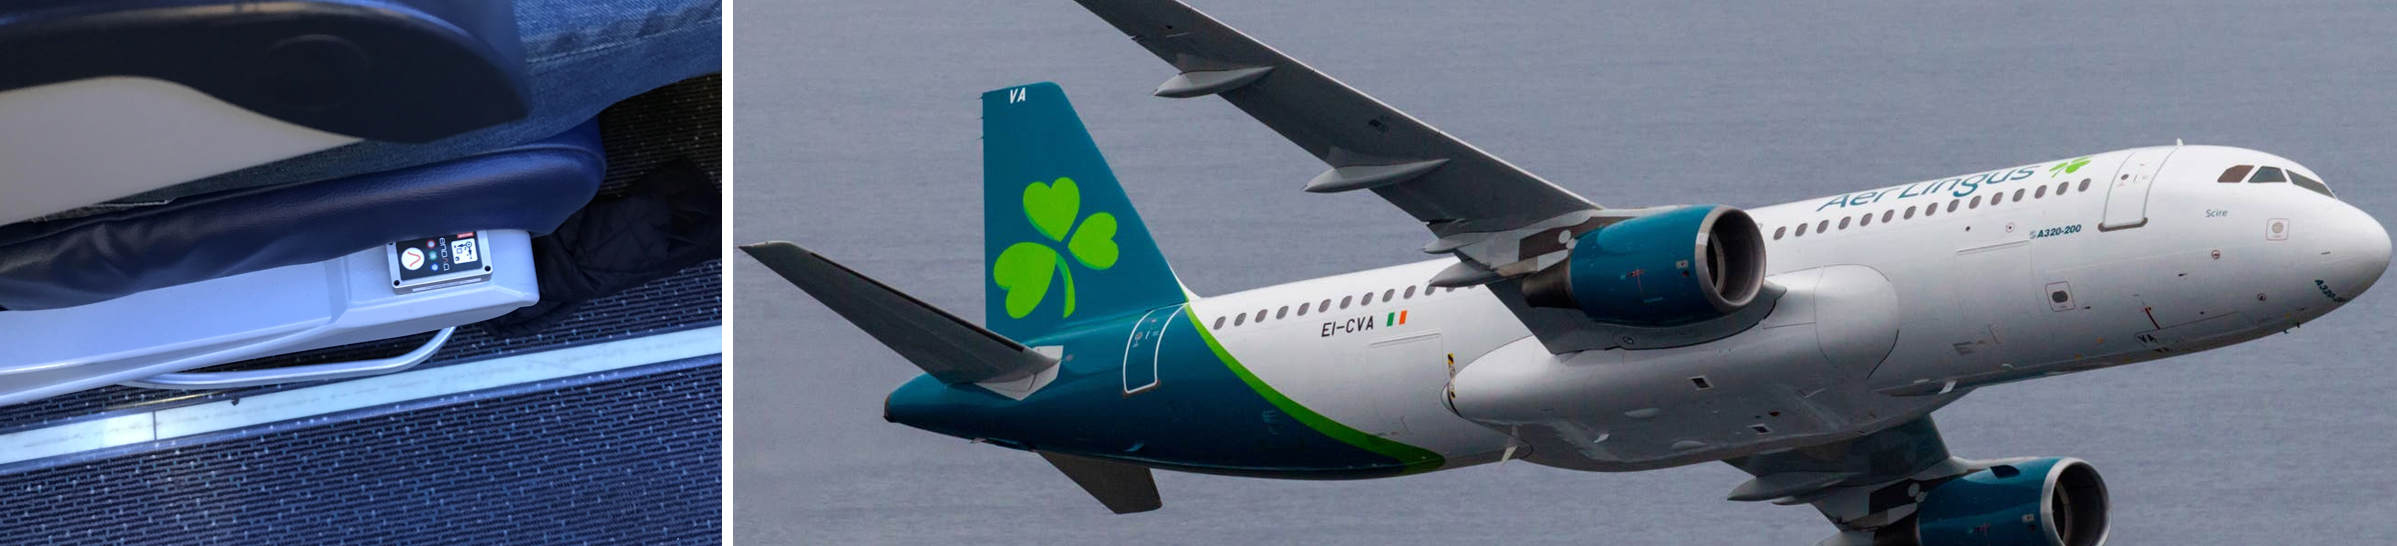
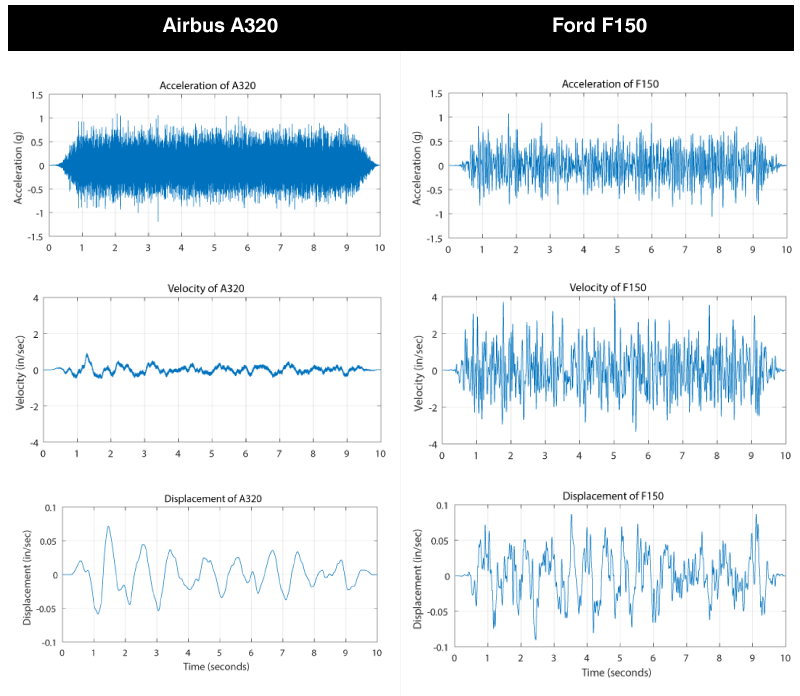
Vibration on the Seat of an Airbus A320 During Flight
The first application was on a commercial Aer Lingus flight from Dublin to Paris on an Airbus A320. I mounted the sensor (specifically a S2-D40D200) on the structural part of the seat next to the cushion. This captured the vibration environment of both what a human will experience (after accounting for any damping provided by the cushion) as well as what the armrest that contains all the electronics is excited with. There is a funny story here with how the flight attendants eventually noticing this blinking device on the aisle seat... thankfully I wasn't arrested.
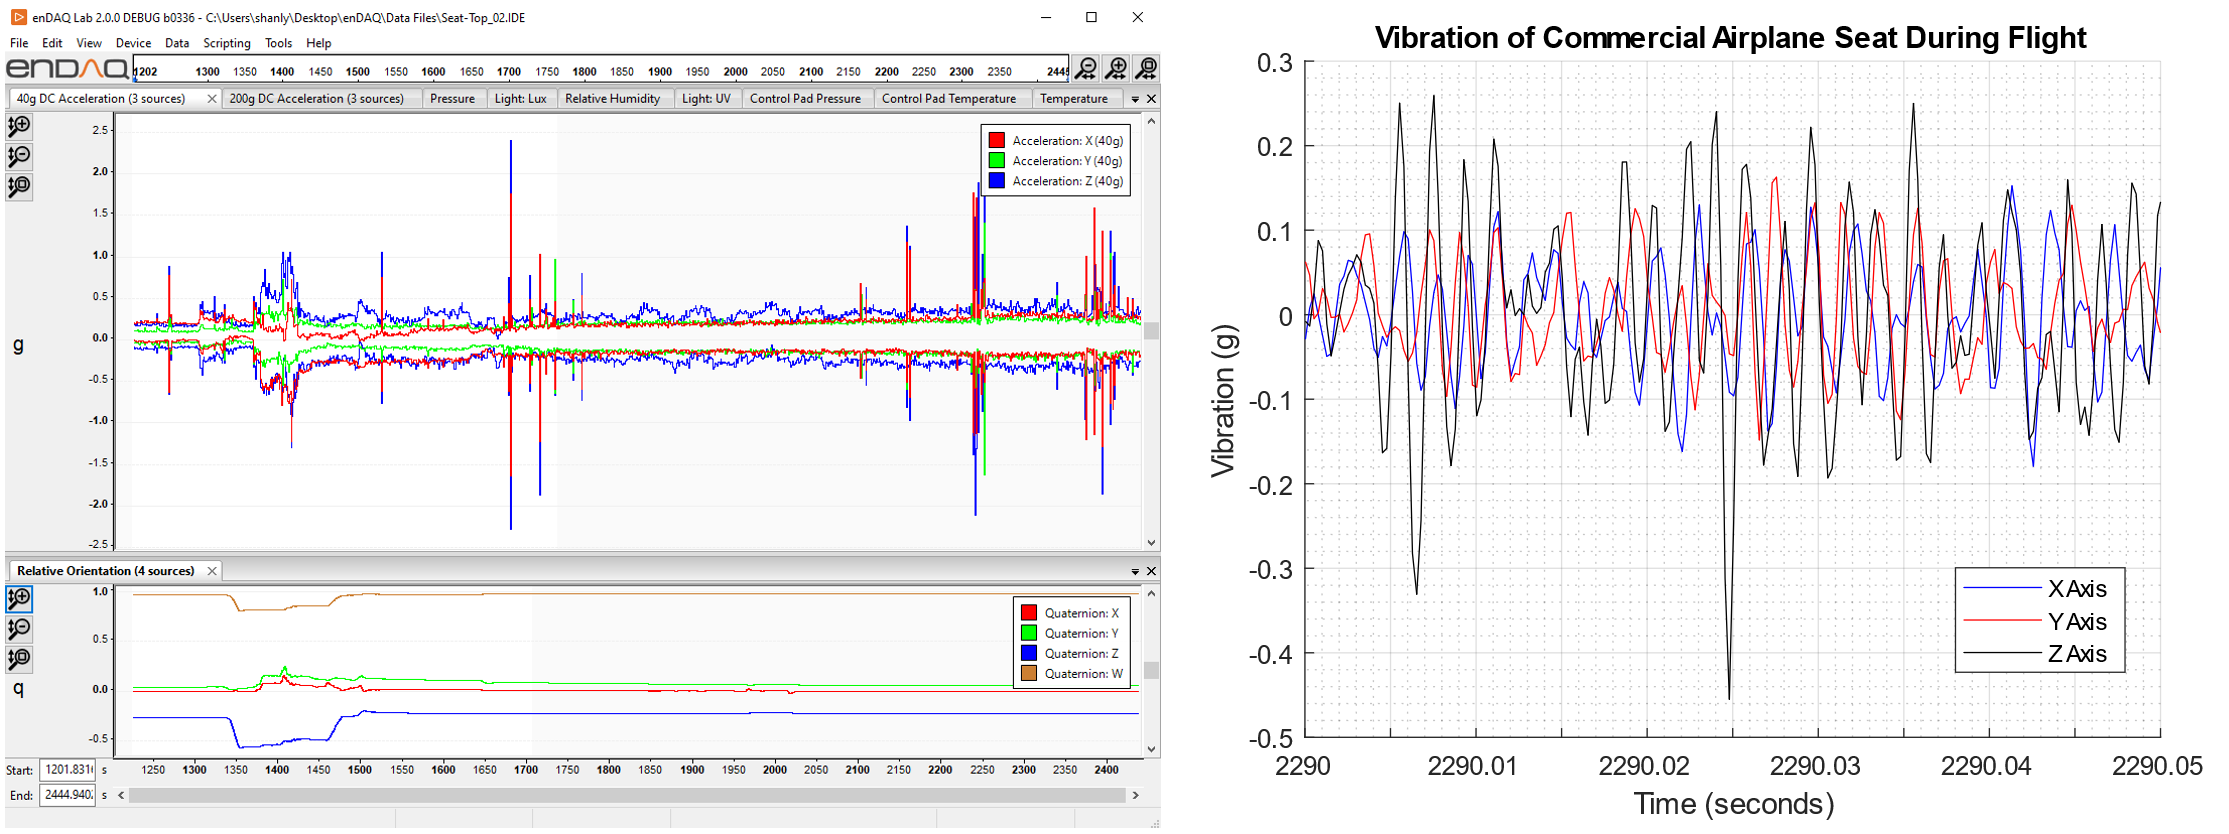
The data from the flight is below, on the left is the 20 minutes of data when the plane took off and then reached altitude. You can see the orientation sensor showing the plane taking off in the beginning then leveling off which is cool, this data is displayed using the enDAQ Lab. On the right is a snapshot of 0.05 seconds during which the plane reached "normal" operating conditions. For the remainder of the article I'll be analyzing a 10 second period during that regime.
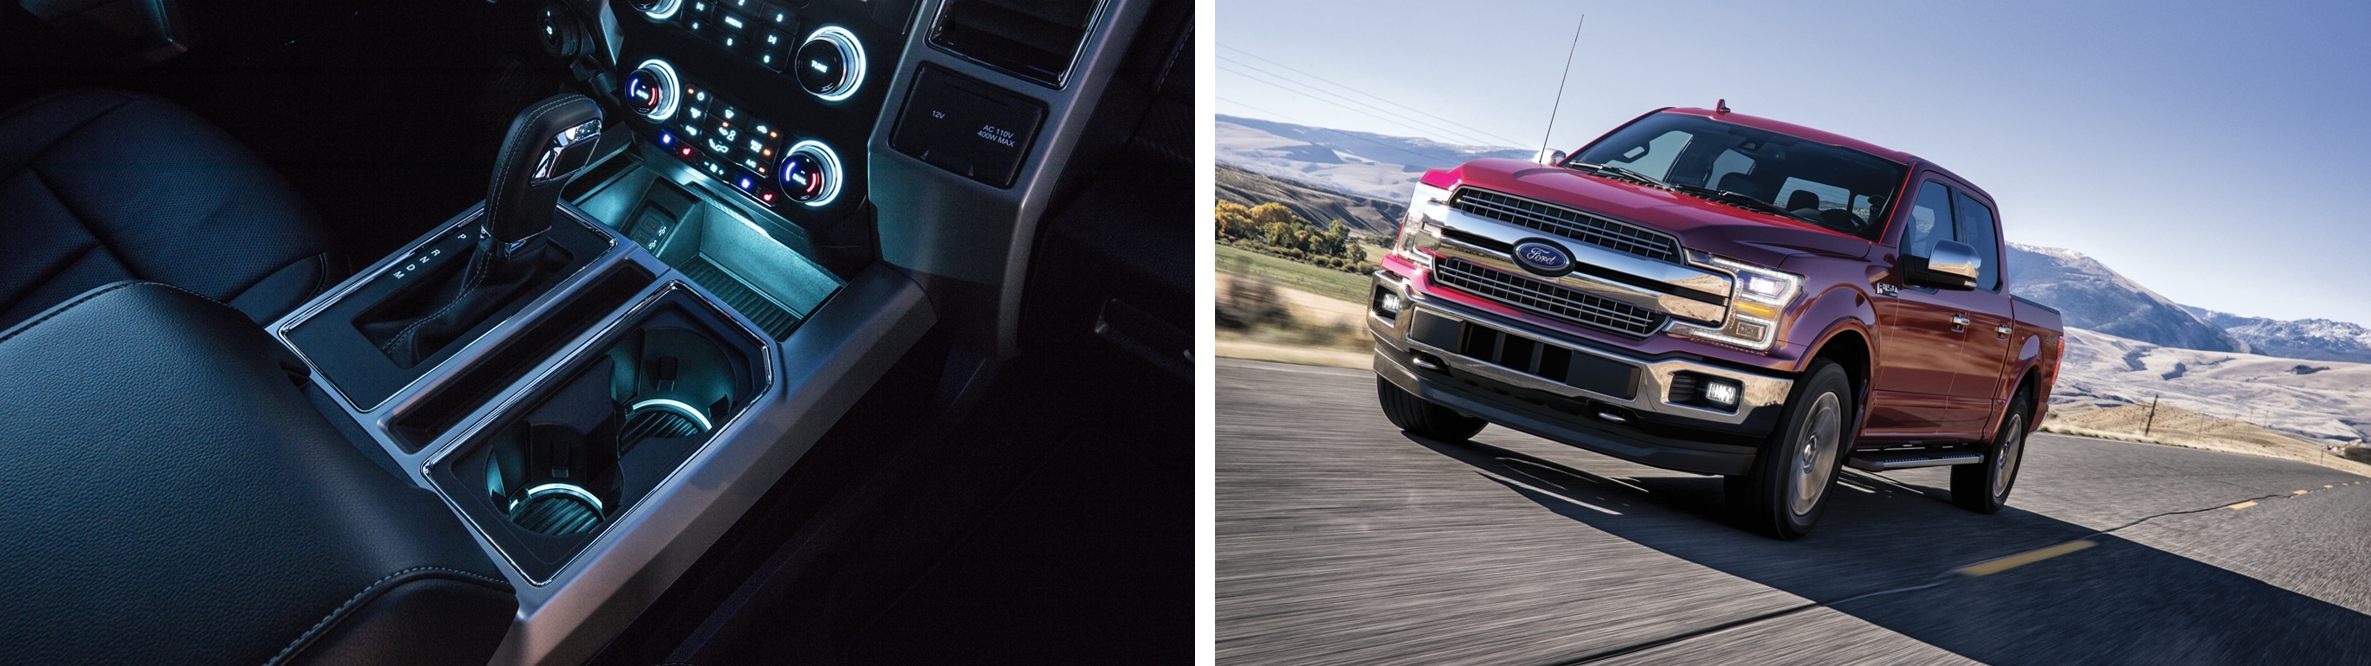
Vibration in the Interior of a Ford F150
This other application is for a customer who was developing a device that would be installed in the cup holders of commercial cars and trucks. They wanted to understand the vibration environment of a typical car to then inform their design decisions of this new product as well as test their prototypes in the laboratory on a shaker. I don't have pictures of the actual test (they did use one of our enDAQ sensors, specifically the S3-E100D40) because it was part of a proprietary development, but I can say it was in a Ford F150. We also tested a Subaru WRX, but the truck had a harsher vibrating environment which is to be expected.
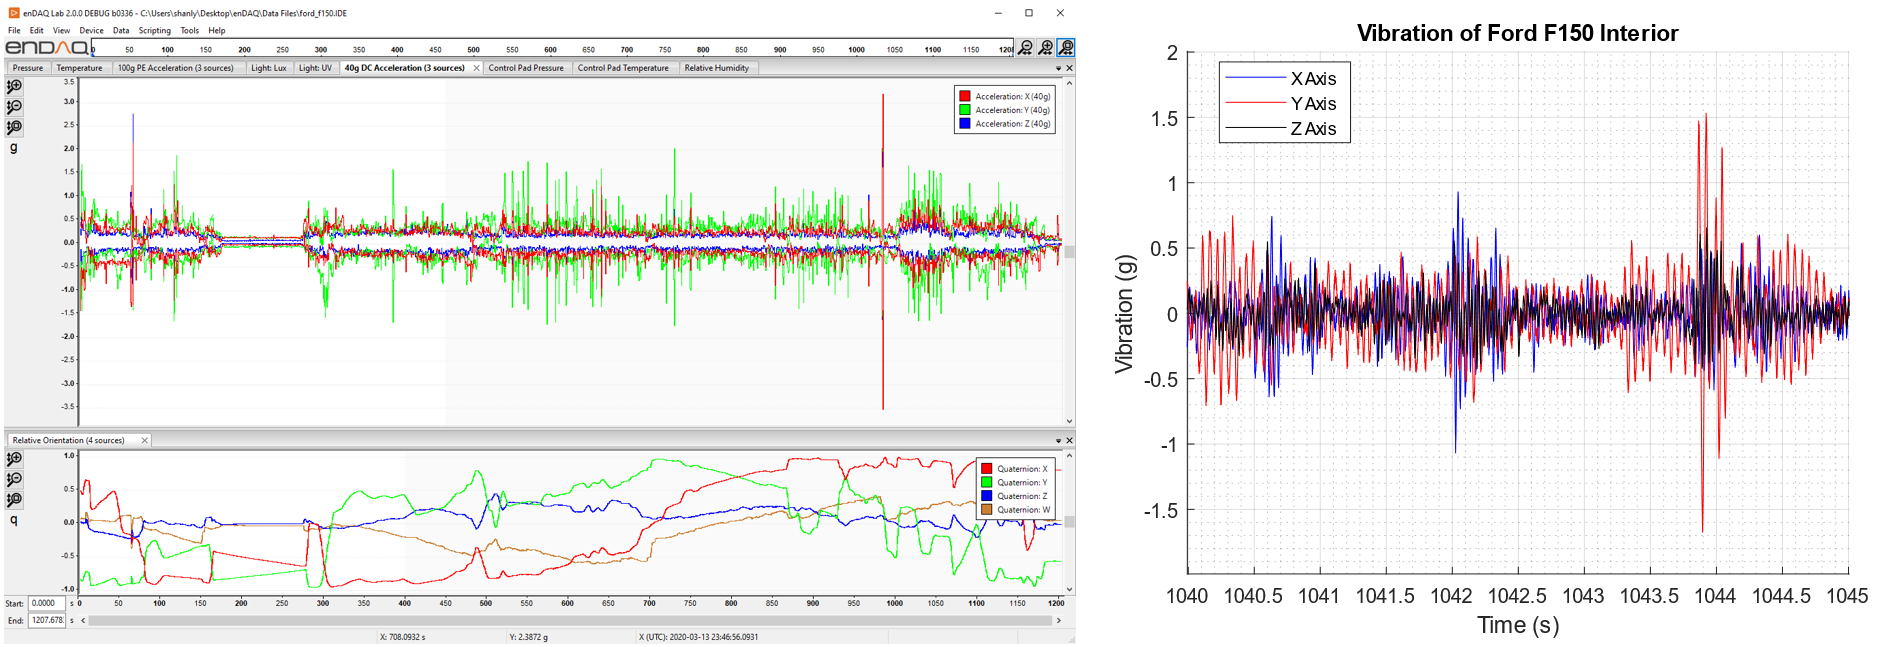
We had hours of data to go through (like we did on the plane) but I found a representative period of 20 seconds (only 5 is shown on the right to make it more discernible) of harsh and typical vibrations we'll analyze throughout the article. But on the left is a 20 minute segment shown again with the orientation data which is interesting.
Important Takeaway About Acquiring the Experimental Data
One thing I want to highlight is that in both instances I had hours of data. And in both instances I went and found a few periods of interest - I did not calculate a PSD on the entire data set. This is something I see engineers do so often, they want to just get an "average" of the vibration environment to then use in their design and later qualification testing. In the vast majority of cases, that is frankly a bad decision! Doing this runs the risk of dulling and even eliminating harsh vibrations that are intermittent, yet present for prolonged periods of time.
Instead, you should find these harsh conditions by calculating a moving RMS throughout the full data set and/or a spectrogram (I did both using the enDAQ Analyzer). And in some cases you may find different sets of harsh conditions that may be largely unique from one another and both used, separately, to guide your design and qualification testing. After all, your system will be exposed to that environment and therefore needs to survive it. It won't however be exposed to some fictional amalgamation of different operating conditions.

Calculating the Power Spectral Density (PSD)
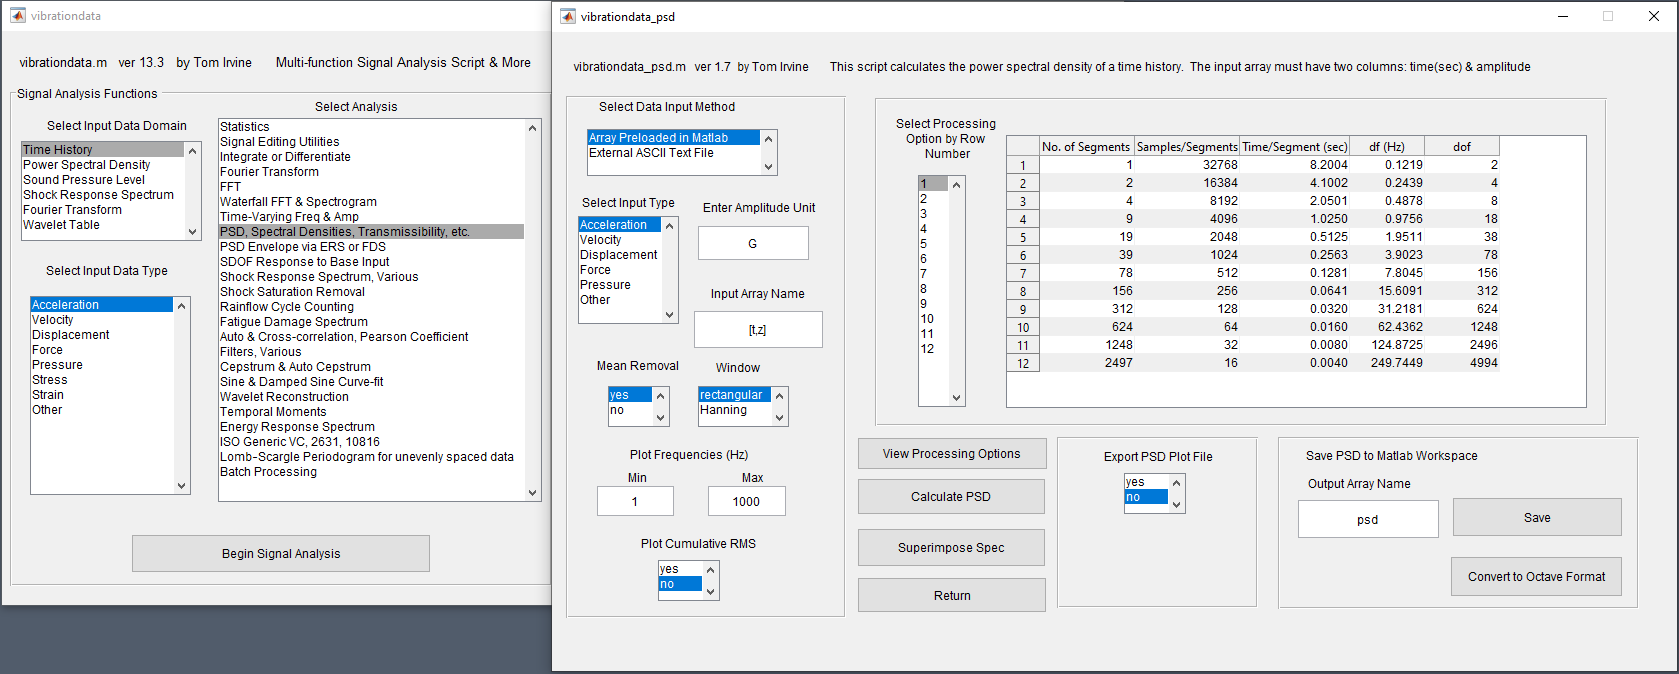
Now that we have the raw data (and a representative area of interest) we can calculate a PSD (sometimes called an acceleration spectral density or ASD). The Toolbox (again, freely available to download) provides a dialog to calculate this PSD as shown. The first thing that will jump out at you is the number of "processing options" you have with the PSD. You are selecting which frequency bin width to use for your PSD. A wider bin width will simplify the PSD but lessen the peaks of any resonances, while the opposite effect is seen with thinner bin widths.
The next series of plots illustrate how changing the bin width provides noticeable changes in the resulting PSD.
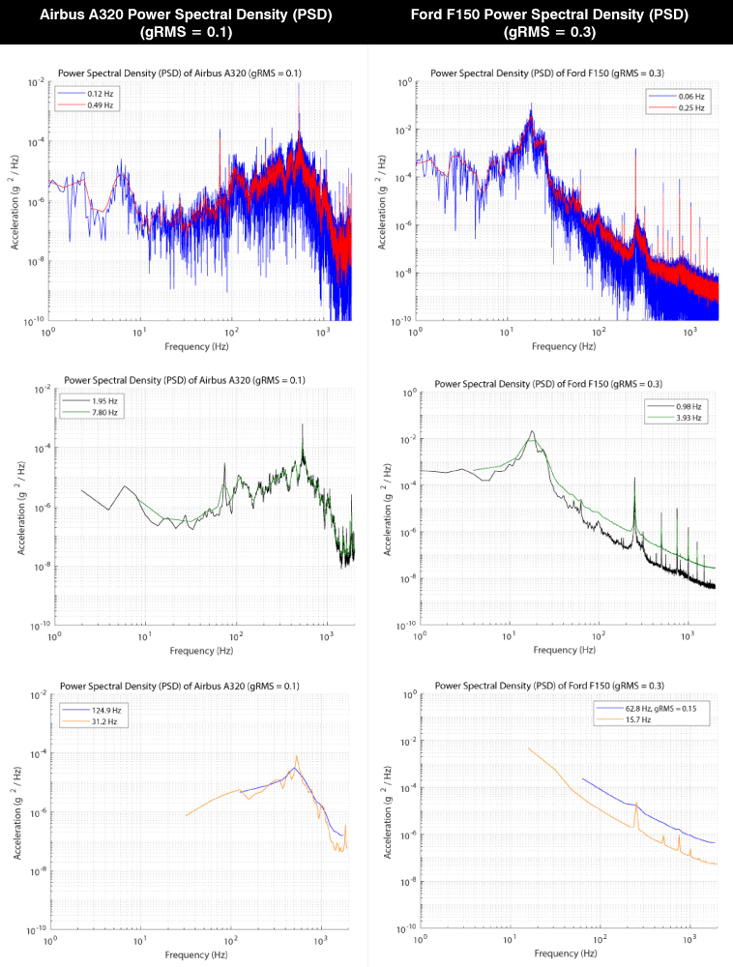 One thing to highlight is that even though the peaks have been muted the total energy level in the PSD as indicated by gRMS has remained constant. The one exception is for a bin width of 62.8 Hz in the Ford F150 data which is simply due to the fact that half of the vibration energy lies below that frequency. Unfortunately there is no simple rule of thumb to use to select the right bin width for your application, you'll have to use good engineering judgement.
At the end of this PSD calculation you will have an accurate power spectral density of your environment, but that PSD can range in size from 100 points to many more than 10,000. And this was for a time series of only 10 or 20 seconds long! These are far too many breakpoints to be used as a test standard, ideally we want to have between 4 and 10 breakpoints for a viable test standard.
Converting to Octave Format
Another handy function in the VibrationData Toolbox is the ability to convert the power spectral density into an octave format to have discrete break points and the appropriate slope in a dB scale.
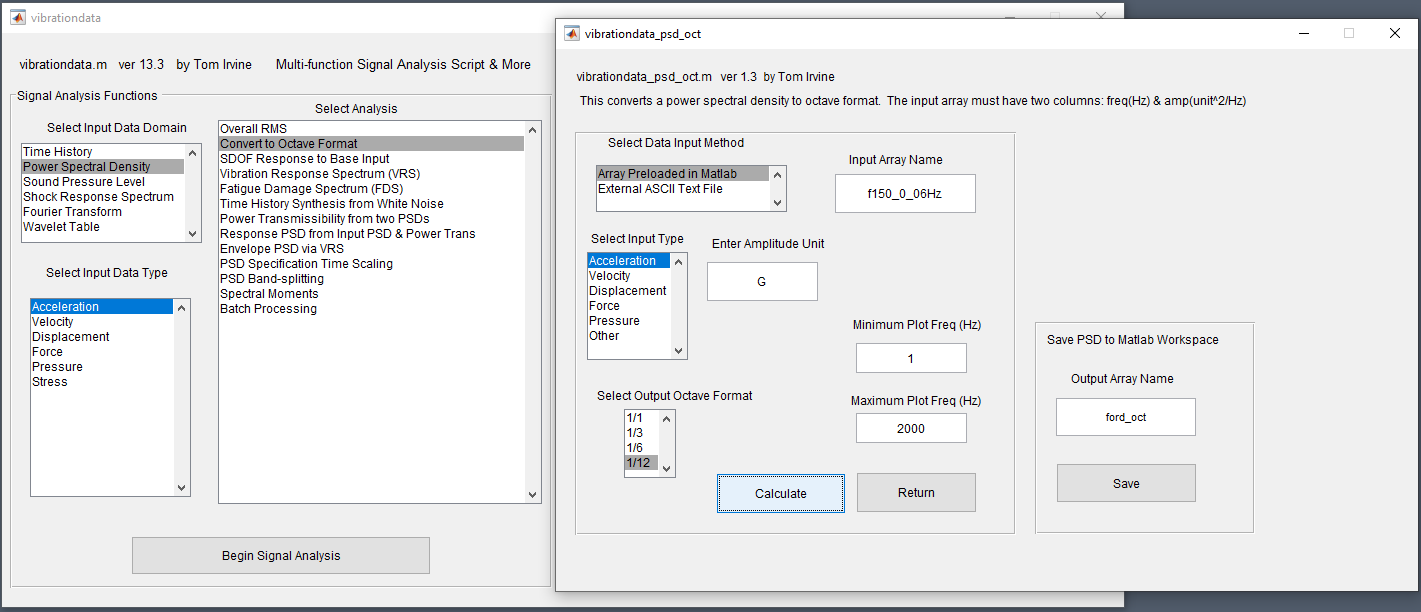
The 4 different slopes (1/1, 1/3, 1/6, and 1/12) result in a PSD that has 10, 29, 58 and 108 break points which is a significant reduction from the longest length PSD from the experimental data of over 32 thousand! These different octave formats define the relative logarithmic spacing between frequency points starting at 1 Hz. Each subsequent frequency location is equal to the previous times 2^(1/n). So for the 1/3 format you would have:
- 1.0 Hz
- 1.3 Hz (1.0 * 2^(1/3))
- 1.6 Hz (1.3 * 2^(1/3))
- 2.0 Hz (1.6 * 2^(1/3))
- 2.5 Hz (2.0 * 2^(1/3))
- ...
- 10 Hz (8 * 2^(1/3))
- 13 Hz (10 * 2^(1/3))
- 16 Hz (13 * 2^(1/3))
- 20 Hz (16 * 2^(1/3))
- 25 Hz (20 * 2^(1/3))
You get the idea! So it makes the spacing very "clean" in the log-log PSD plot. Here are the PSDs in octave format for the different slopes or formats:
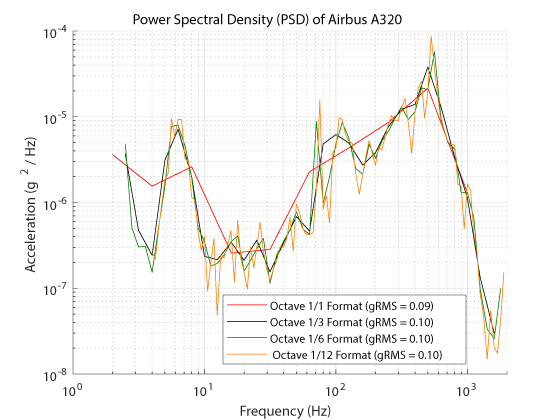
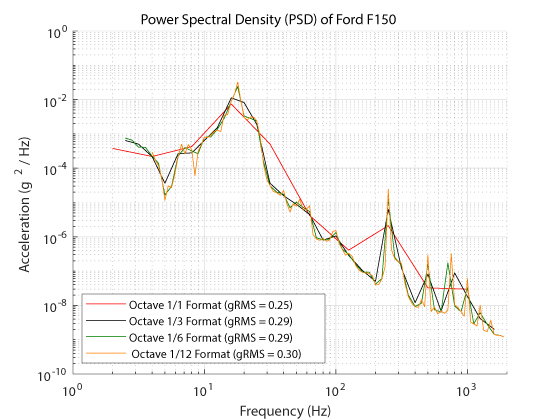
For some you may consider this the end! You have a PSD with 10 breakpoints, a manageable amount to use as a "test standard" to inform design decisions and replicate the environment in a laboratory setting. But next we'll do some trial-and-error to further simplify this power spectral density while remaining true to the actual environment.

Estimating a Test Standard
Given the PSD generated from the experimental data and now the octave format, how does one go about estimating an even simpler PSD? The tendency I see engineers often employ is to envelope the PSD by developing a few breakpoints at local maximums of the PSD. We'll find in the next section that this will artificially create a much harsher environment that isn't all that representative of the real one!
A better technique is find a blending between the PSD converted to octave format with the experimental PSD. Then do some trial and error using Vibration Response Spectrums (VRS) which I'll highlight in the next section, to find a simplified PSD that is true to the actual environment.
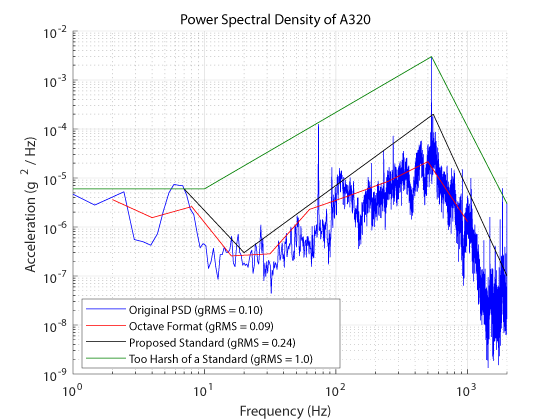
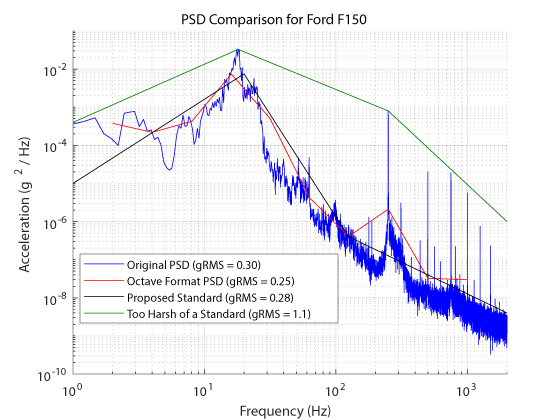
The previous two plots compare:
- Original PSD with many breakpoints
- PSD converted to octave format with 10 breakpoints
- Proposed PSD standard with 4 or 5 breakpoints
- Too harsh of a PSD that many engineers tend to make
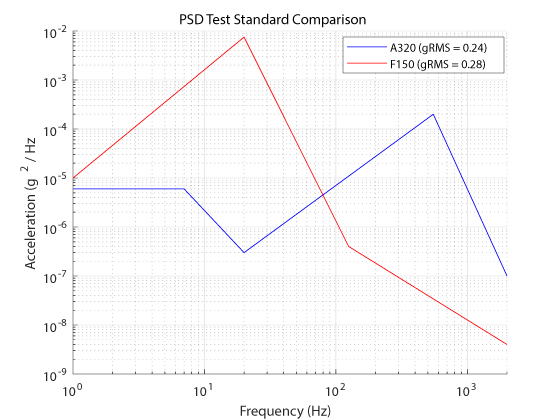
One quick way to see the discrepancies between these PSDs is to take a look at the average vibration level defined by gRMS. Our "standard" is pretty spot on for the Ford F150, although it is a little high on the A320 which I'll highlight later why. The PSD many engineers make that takes all the peaks is 3 to 10x higher though!
Checking the Standard Using a Vibration Response Spectrum
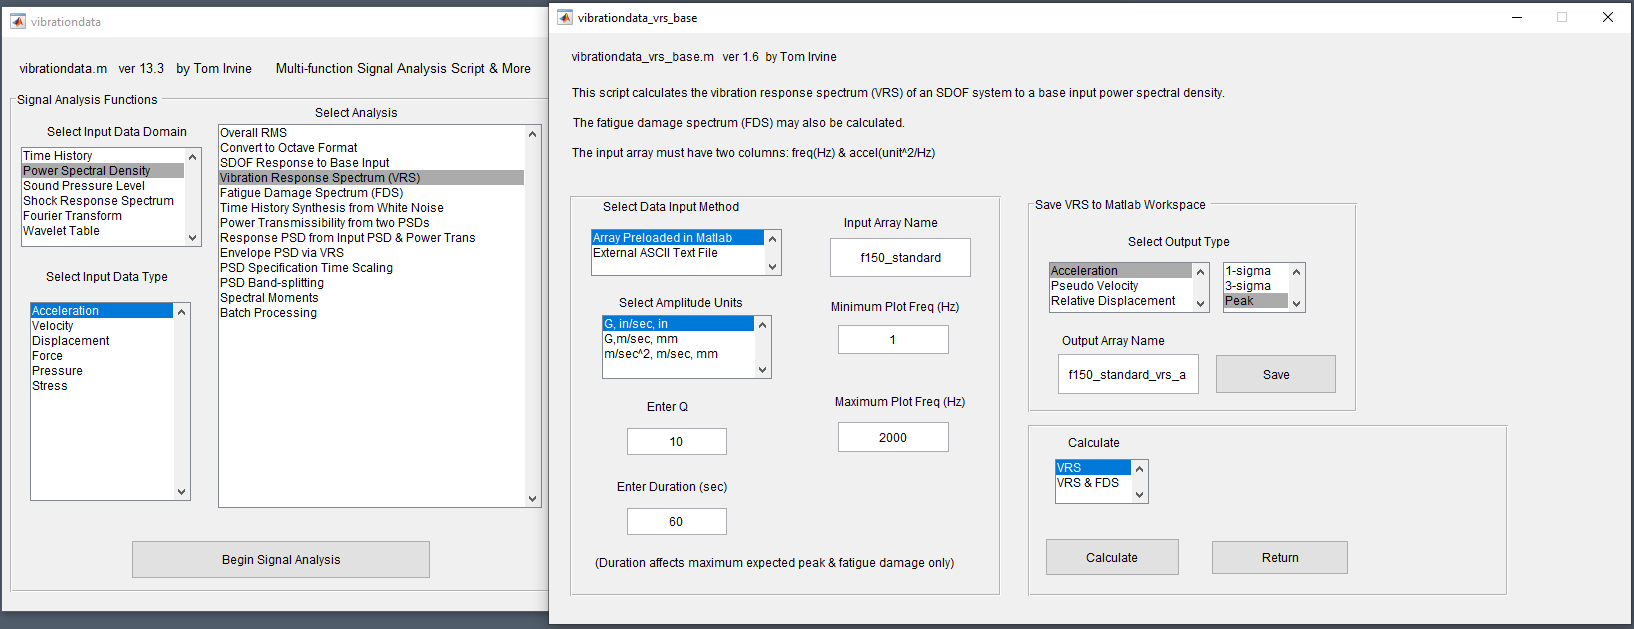
A vibration response spectrum is a really powerful yet underutilized tool by design engineers. It takes a PSD and then calculates the response of a hypothetical system for a range of different natural frequencies of that system. It tells you what frequencies to avoid in your design and how your system will react. Often times you will see that a hypothetical system will amplify or increase the acceleration, velocity, or displacement environment if poorly designed. This is the preferred way to check your PSD standard compared to the experimental vibration data.
The Toolbox has the ability to calculate this vibration response spectrum given a PSD input. And this calculation is not limited to just the acceleration response, but also how does the velocity and relative displacement of your hypothetical system respond.
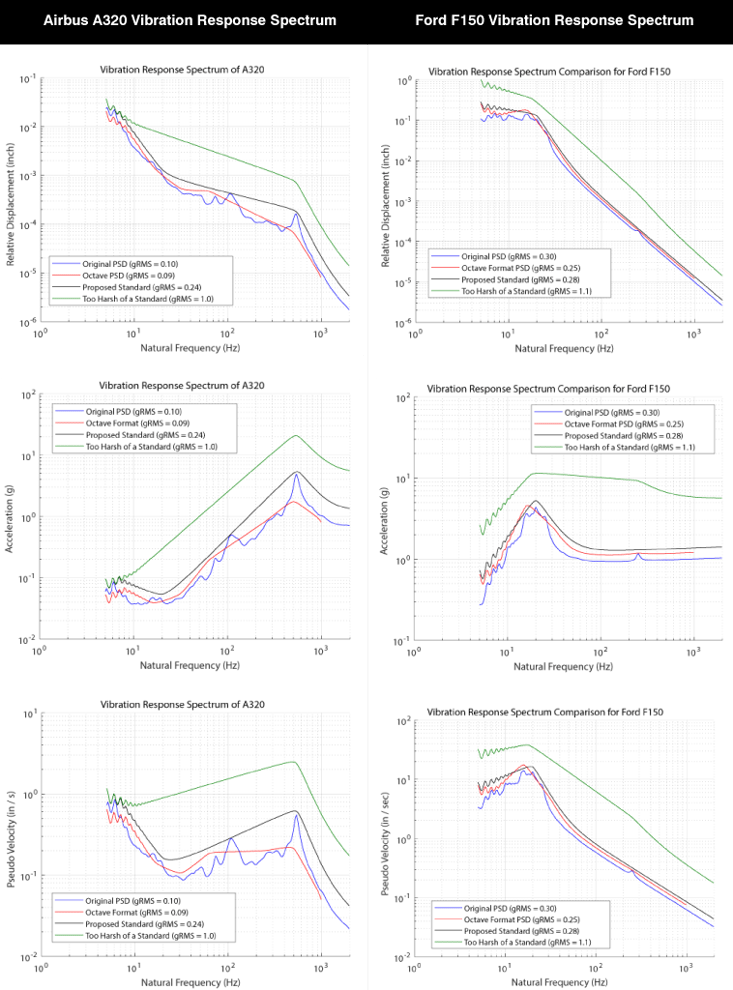
Calculating the vibration response spectrums of the A320 data compared with our standard we are proposing highlights a few interesting points:
- Although the PSD amplitude at a 5 Hz natural frequency is far lower than the resonance at 534 Hz, a system that has the 5 Hz natural frequency will experience much harsher displacements and velocities (and therefore greater likelihood for failure)
- The peak acceleration of a system with a 534 Hz resonance would be about 5g which is a significant magnification of the environmental input of about 0.5g
- The "too harsh standard" that engineers typically generate is well... too harsh and misrepresents how a system would respond to the actual environment.
For the Ford F150 the big area of concern is that ~20 Hz region that exhibits the most significant displacement, velocity and acceleration reaction if a system was designed to have that natural frequency. The amplification isn't as severe in the A320 but acceleration levels would double.
 Don't Develop Too Harsh of a Standard
Hopefully the above section really highlights that when an engineer just draws over the peaks of a PSD to then develop a test standard they can later use they are misrepresenting the environment. And generating too harsh of a standard has a few consequences:
- Increase cost in your design unnecessarily to overcome that environment
- Increase development time
- Shift your focus away from key frequency areas
A better way to build in a safety factor is to go through the test standard development like we just did by using the octave format conversion and then trial and error with the vibration response spectrum. Once reaching the place we are now, you can simply apply a safety factor of 2x or 10x to the PSD which will carry this safety error through to the vibration response spectrum and the time synthesis next. This is the benefit of developing a power spectral density standard and then using it in to drive design decisions and test procedures. You can also use a 10x PSD to simulate exposure to that environment for 10 times longer a test duration which can be helpful to save time.
Time Series Synthesis off the Standard
Now that we have developed the simplified PSD we can take this to simulate the environment in the laboratory. You would input the PSD into a shaker system but the VibrationData Toolbox can also do a time series synthesis off the PSD to give you an idea of what the environment looks more intuitively.
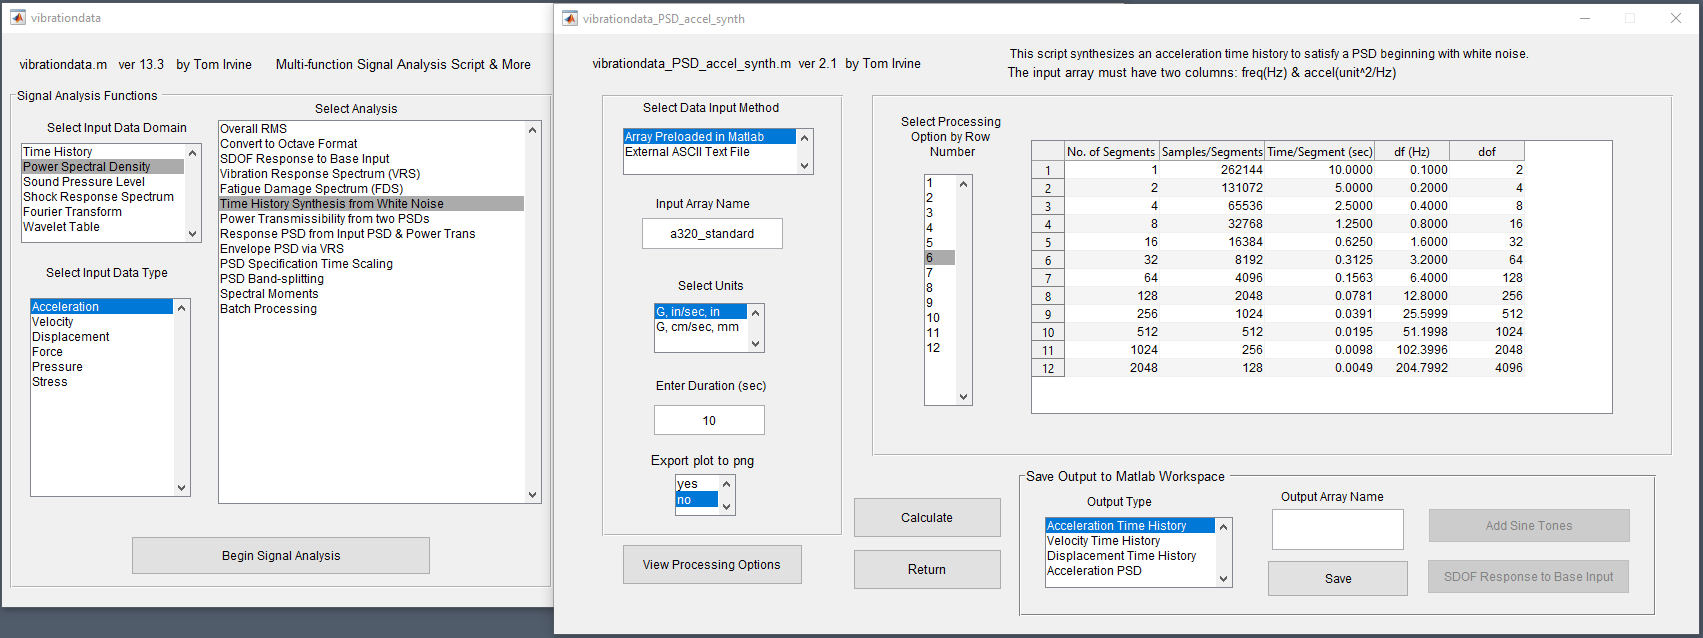
Here are the time series synthesized off of their respective power spectral densities, followed by a comparison of these two test standards. You'll notice that they each have similar acceleration amplitudes which is consistent with their similar gRMS values. They also have similar amplitudes for displacement; but velocity is an order of magnitude more severe in the F150 cup holder which I found interesting. I suspect this is due to the fact that the acceleration levels are most severe for a lower frequency.
Conclusion & Additional Resources
Well hopefully if you've got this far you have gotten some value from the article and found it interesting! Remember the data I analyzed is available to download and the VibrationData Toolbox is also freely available to download to do some of your own analysis! If I had to recap in a few bullets, here's what they would be!
- Go get the experimental data in your real environment, don't rely on test standards - develop your own!
- Don't use the entire dataset for the PSD calculation, find areas of interest using a spectrogram, moving RMS calculations etc. If you calculate an "average" PSD of the entire dataset you may be completely eliminating periods of time that are harsh yet short. You're better off developing a handful of PSDs for these harsh environments as well as other ones for other stretches of operating conditions.
- Find a frequency bin width of your PSD that provides a clear profile without eliminating natural frequencies
- Converting the PSD to octave format will reduce the number of break points from thousands down to as few as 10
- Use some trial and error with a vibration response spectrum to find a PSD test standard, don't just draw over the peaks of the PSD
- Use that vibration response spectrum to identify frequency ranges to avoid in your design
- Develop a time series synthesis off the PSD to intuitively understand that environment and use it to replicate it in the laboratory
As always, don't hesitate to reach out to us with any questions on this topic or others. We're here to help accelerate your testing!
Related Posts:
- Why the Power Spectral Density (PSD) Is the Gold Standard of Vibration Analysis
- Vibration Sensor Types and Where to Buy Them
- Calculating Tire Speed from Vibration
For more on this topic, visit our dedicated Vibration Loggers & Vibration Sensors resource page. There you’ll find more blog posts, case studies, webinars, software, and products focused on your vibration testing and analysis needs.