What is an "Independent Observer"? A person, or thing, that has a different view of a situation than the primary observer.
Football fans know it well. A referee makes a call on the field that the team coach disagrees with and protests. The officials gather around a TV monitor to see what evidence there is to indicate that the call was right or wrong. The cameras have different views of the play—perhaps not as clear as the ref’s eyes, but the different views may show that the call was wrong (or right).
The critical feature of the Independent Observer (in this case, the camera) is that it does not have the same technology and/or capabilities as the primary “measurement” (the ref’s eyeball). In this case, the Independent Observer may be better than the primary sensor but that is not necessarily (or often) the case.
In this post, I'll cover:
- An Independent Observer may catch a critical, or even fatal, testing error.
- Example 1: A Poorly Designed Experiment
- Example 2: A Poorly Designed/Implemented Data Acquisition System
- Example 3: Does your Vibration Control System really do what it says it does?
- Finally: A Cautionary Warning
Independent Observer may catch a critical, or even fatal, testing error
How does this apply to test data acquisition? We need to ask ourselves: What are some of the inherent shortcomings of our data acquisition system? Here is a short list of candidates:
- My first blog asked Is Your Data Acquisition System Telling You the Truth? There I discussed a variety of errors and distortions that our digital data acquisition system will introduce into our view of the data.
- Our measurement system bandwidth is limited by the sample rate S. We cannot see anything above the Nyquist Frequency (S/2). What if there is significant energy above that frequency?
- If our system does not have a good alias-protection strategy (Blogs 2, 3, 4), we may have significant errors that will not be evident from the measured data.
- The data acquisition and digital-control manufacturers sell systems that purport to tell the truth. They have great displays of the data as they see it. Are they telling the truth…or the whole story?
An important feature (or “un-feature”) of the Independent Observer is that, in most cases, it need not be very accurate or powerful. It may be a rough check on the sanity of the measurement. Its objective is to catch significant errors.
So, what are we looking for? Let’s discuss some of the types of errors that should be spotted if a proper Independent Observer is used.
Example 1: A Poorly Designed Experiment
Back in the olden days before I knew better, we were driving a test with a digital signal generator (Digital-to-Analog converter/DAC) that did not have a low-pass filter on its output. We were monitoring the test with a good data system that had an anti-alias (low-pass) filter that cut off the high-frequency energy above the Nyquist frequency. We ran a sine-sweep test and the ANALOG RMS shutdown system tripped us offline—repeatedly at the same point.
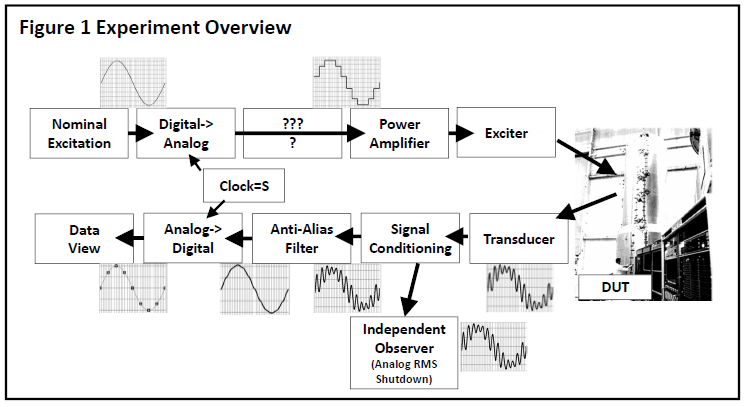
The test-system elements are shown in Fig 1:
- The nominal excitation waveform: a sine wave.
- The digital-to-analog converter is generating a “stepped” waveform.
- A power amplifier and exciter (shaker) that drives the test article.
- The Device Under Test (DUT).
|
A Little History The DUT was the “iron maiden” test model of the future Hubble Space Telescope that was constructed and tested at Lockheed in 1973. The objective was a characterized microG modal response of the mirror simulators to excitations from the reaction wheels. MODALAB, the in foreground, was the 256-channel real-time sine-sweep control/acquisition/analysis system developed to dredge out the low-level responses. |
- The transducer (accelerometer) measures the response.
- Signal conditioning converts the transducer output to volts. Its output went to two places:
- The Independent Observer: an RMS over-test detector.
- The Data Acquisition System that included a low-pass/anti-alias filter and an analog-to-digital converter sampling at the same rate as the digital-to-analog converter (“Synchronized Data Acquisition”).
- The outputs of the system and the Independent Observer go to where they can be viewed and acted upon.
So, what was causing the shutdown? Let’s make a model of a simple test system:
- We are generating the excitation and acquiring at 100 Samples/second.
- The anti-alias filter, chosen and set to provide good alias protection, limits the bandwidth that the digitizer sees to about 45 Hz.
- The Nyquist frequency is 50Hz. Our digital data acquisition system cannot see anything above that frequency.
- The mechanical system has a transfer function that includes modal responses. To make it simple, I have modeled it as a single mode with a Q of 10 at 150 Hz.
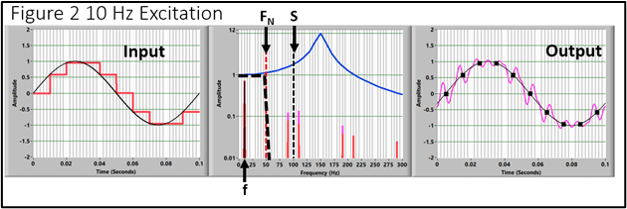 Figure 2 shows the situation:
- The left frame shows the desired excitation (black) and the digitized version (red).
- The center frame shows the spectra:
- The desired excitation frequency is 10 Hz (F).
- The stepped waveform produces frequency spikes at the folded frequencies: 90, 110, 190, 210 … = N(S+F) where N is an integer, S is the Sample Rate, and F is the input sine frequency. These are excitation frequencies that the specimen sees.
- The system transfer function (blue) produces a distortion of the input (amplitude and phase).
- The anti-alias filter (dashed black) reduces all frequency components above the Nyquist Frequency before digitization.
- The resulting output time histories are shown in the right panel.
- The purple line is the total response of the system. The ripple is caused by the transfer function’s reaction to the excitation and the spurious components produced by the digitization.
- The black squares are the digitized version.
- The black line is the interpretation that we see in the digitized version.
- Figure 3 shows the situation when the excitation frequency is increased to 30 Hz.
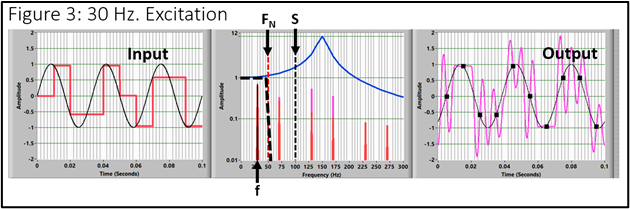
Now the reflected images of the excitation are interacting strongly with the gain of the transfer function. It is easy to see why an RMS detector would cause a shutdown that we could not see with the digitized data.
We dragged in a spectrum analyzer to look at the raw analog signal. It showed results similar to those shown here. The DAC was producing high-frequency noise that we filtered off in the acquisition system so we couldn't see it. The analog shutdown system (and the specimen) saw all of it. In some cases, we might have broken something.
The fix for the problem was straightforward. The missing component in the excitation system is an analog low-pass filter following the digital-analog converter. Lesson learned.
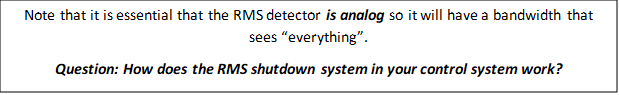
What was the primary Independent Observer? The RMS detector. It must be an analog calculation so that it's bandwidth is not limited. Then, a spectrum analyzer gave us a better view, and understanding, of the problem.
Example 2: A Poorly Designed/Implemented Data Acquisition System
In all of my blogs, I have endlessly discussed the fact that the fundamental hazard of the digital data acquisition process is aliasing. Despite my (and many others) harping, critical tests are still being performed that have significant aliasing errors. One example happened in a major testing lab a few years ago. I will show how it happened and how an Independent Observer should have discovered the problem early in the test sequence and not after tens or hundreds of tests had been performed.
The tests being performed were pyrotechnic (explosive) events that produced a lot of high-frequency energy—frequencies much higher than those of interest for structural damage. However, that energy is sensed by the transducers and must be handled properly by the data acquisition system.
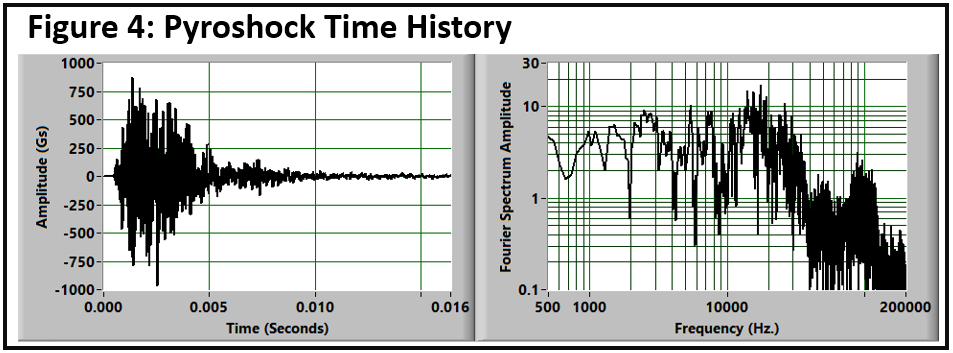
I am going to use the PyroShock Time History that I have used for so many demonstrations (Figure 4). It has lots of energy out to 30 KHz and significant energy to 80 KHz.
Let’s assume that the maximum frequency of interest (potential damage) is 3 KHz. Then, a sample rate of 36KS/S gives us over 10 points/cycle at the highest frequency (the standard minimum for shock testing). The raw and sampled time histories are shown in Figure 5. In this view, it is easy to see that it is not sampled fast enough. However, the acquired data only shows the red data values. It is not obvious that they are corrupted.
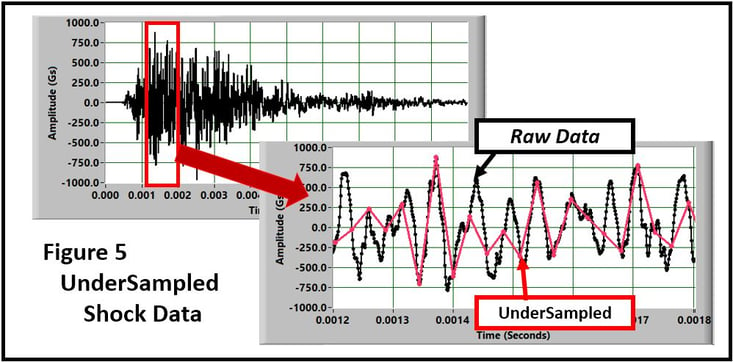
Figure 6 shows the spectra in Fourier and Shock Response forms.
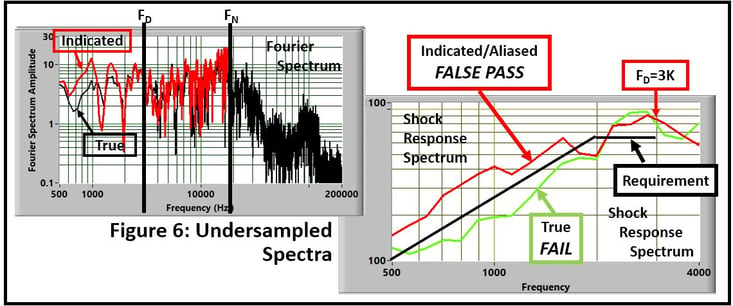
The red curves show the acquired/undersampled results.
- The Fourier spectrum is truncated to the Nyquist Frequency (18 KHz).
- All of the energy above 18 KHz. is folded back corrupting the true value.
- The indicated spectrum (Red) is significantly higher than the truth.
The Shock Response Spectrum shows the real problem. - The objective of the test was to prove that the specimen could survive the specified environment: The black “Requirement” line.
- The undersampled/aliased result is above the requirement indicating a false pass.
- The end result is that the test incorrectly satisfied the requirement.
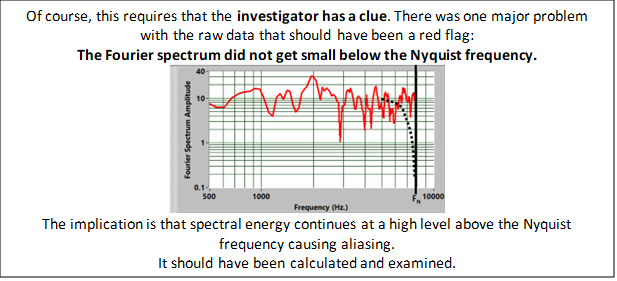
What do we need to provide an Independent Observer for this test? A digital oscilloscope/spectrum analyzer with a bandwidth of at least 1 MHz. The in-band level difference might be hard to see but it would have shown that there was a lot of high-frequency energy that is present and unaccounted for in the acquired version.
So, how should the data have been acquired? A solution is an analog anti-alias filter before digitization. Figure 7 shows the results when an 8-pole Butterworth filter at 20KHz. is applied.
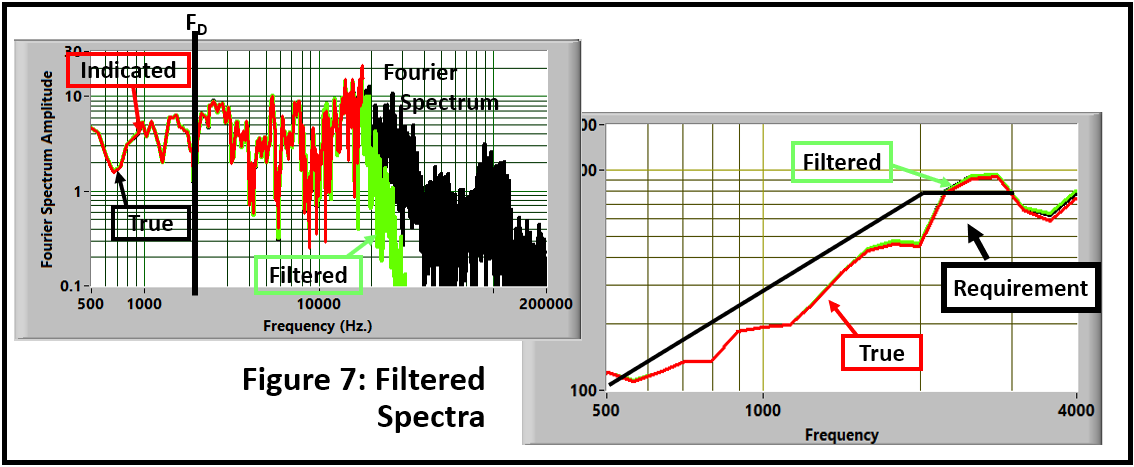
In addition to the need for an Independent Observer, there is one critical point to make: Always calculate the Fourier Spectrum of your data. Many errors are made obvious there.
Example 3: Does your Vibration Control System really do what it says it does?
One of my prime concerns is whether digital vibration test control systems actually do what they claim. They have beautiful displays that show what they believe is the truth. Is it really?
The objective of the Independent Observer is to confirm (or not) the validity of the process.
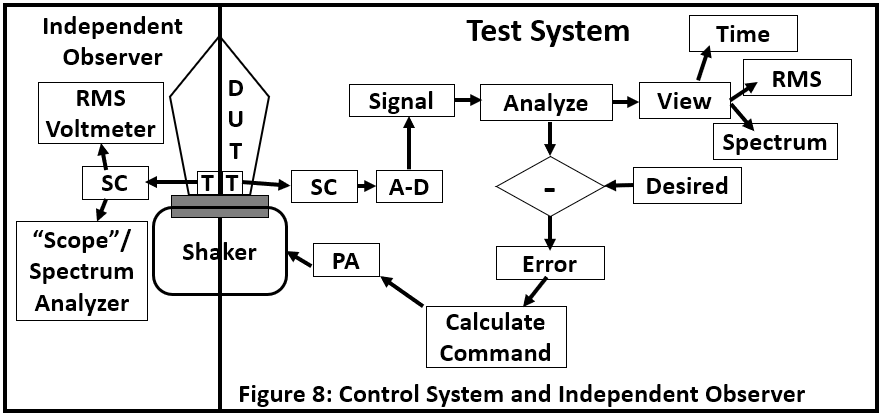
Let’s look at the procedure (Figure 8). Simply put, it is a closed-loop control system that is trying to make the exciter (Shaker) produce the desired response at the transducer (T). The desired and response functions may be Sine, Random, Shock…whatever. The algorithm and displays will be appropriate for each of the application processes. Displays might include time history, spectrum, and RMS level indications.
The problem is that the system only acts on and displays what it sees from the transducer and the following analysis. What could possibly go wrong?
The fundamental problem is that our wonderful computer-based systems isolate us from what is really going on at the transducer. The system output may be right...or...wrong. We have no way of telling. The system views the event through a myopic window—the display says you are in control and the result matches the desired. Does it really? It needs to be verified.
An Independent Observer, whose indications agree with the system result, would be a simple verification process.
On the Independent Observer side, we have a transducer (co-located with the control transducer) and signal conditioner followed by relatively simple data-analysis/display systems.
The Independent Observer needs to have one basic characteristic: It must have a bandwidth significantly higher than the test system. Other than that, it does not have to be very sophisticated or accurate. We are only doing a sanity check. 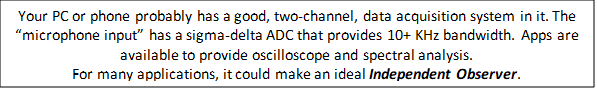
What tests should we do? Emulation of the real test lab activities.
Sine Sweep: Program a slow, constant level, sweep over the full frequency range and monitor the Independent Observer’s RMS and Time History (oscilloscope) displays:
- Does the RMS match the control system’s indication? Both should be constant and indicate a similar level.
- Is there distortion in the oscilloscope time history? If so, the spectral display will help the diagnosis.
Random: Program a constant-level spectrum with lots of averaging over the full frequency range, and monitor the Independent Observer’s RMS and Spectral displays:
- Does the RMS match the control system’s indication?
- Does the spectral shape match the desired (constant)?
- Is there significant energy at frequencies higher than the control bandwidth?
Repeat the test with a typical spectrum shape used in the lab.
In all cases, the most obvious (and simple) indicator of trouble is the RMS measurement. What if the system and monitor indications are significantly different?
- Assuming (hoping?) that our system is correct, the first thing to check is the “calibration” of the Independent Observer’s voltmeter. Have you done the voltage-to-engineering units’ calculations correctly?
- Is the disagreement caused by signal components that are above the frequency range of the controller (so it can’t see it)? The spectrum analyzer will show it. There are several potential causes:
- Rattle or other non-linearity in the shaker system. That is a mechanical problem that needs attention.
- A distortion in the command signal (as was demonstrated in the first example).
- Significant out-of-band energy needs to be tracked down and fixed. It could cause component failures at frequencies that the system does not know about.
- The out-of-band energy needs to be removed before a realistic assessment of the in-band RMS agreement can be made. This should be done by cleaning up the experiment. Failing that, an analog low-pass filter, set at the control-system bandwidth, should be used.
- Failure to reduce the discrepancy to reasonable levels (a few %) by these and other realistic methods indicates a real system problem.
Finally: A Cautionary Warning
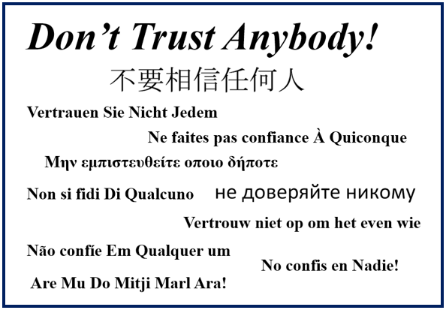
I am going to close with a copy of the slide that I showed at the beginning and end of my data acquisition short courses.
The obvious point is to not trust any vendor, but it goes beyond that. Don’t trust your present equipment: It sometimes will go bad and/or do weird things.
And, don’t trust yourself: Do all of the checks you can think of to block your own biases and stupidities. This is admittedly toughest when you are under the gun. That is when it is most important!
Most of the vendors that service the data acquisition and control world do a good job and offer a good product. However, it is my experience that they often don’t qualify their system as well as they should.
And then, there are the turkeys. Often, they are wearing a very nice costume (in this case, displays). They need to be rooted out. I hope you don’t already own one.
As users, it is our job to be sure that our tools do what they should and preferably, do that in the demonstration phase before we have bought the system. Doing Independent Observer tests is the first, and most critical, qualification step.