Another Goldilocks Decision
I hope that, in the preceding blogs, I have convinced you that a low-pass filter is required (most of the time) to assure that your data is not corrupted by aliasing. The next question is: Which of the myriad of available filter strategies will do the trick in the least obnoxious way? In this edition, we compare the behavior of the most popular options:
- 8-Pole Bessel
- 8-Pole Butterworth
- 8-Pole/8-Zero Elliptical
- Sigma Delta (SD). Note that this is a hybrid analog/digital strategy so the “rules” are very different from the analog options.
It is important to point out that, is some ways, we are comparing Apples and Oranges.
The analog filters: Bessel, Butterworth, and Elliptical, require an analog-to-digital converter to complete the data conversion.
The Sigma Delta filtering process includes an analog filter, digitizer, and digital processing. Most of the filtering operation is done in the digital domain.
The next blog will discuss the nitty-gritty of how these low-pass filters work. The following will be an overview of what they do.
In the first blog, I showed the results of filtering my favorite shock time history with these filters with a cutoff frequency of 10 KHz.
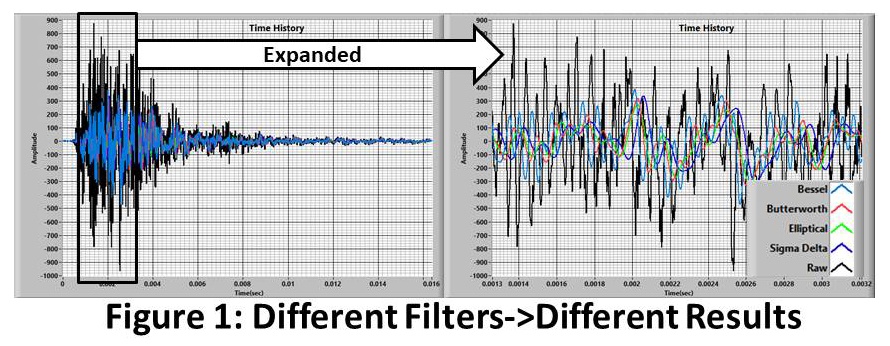
Obviously, the results are different. Which is right?... None... Which is “rightest." That is in the eye of the beholder.
So, What is Filtering? We Need a Few Basics
What are we doing? Figure 2 cartoons the filtering operation.
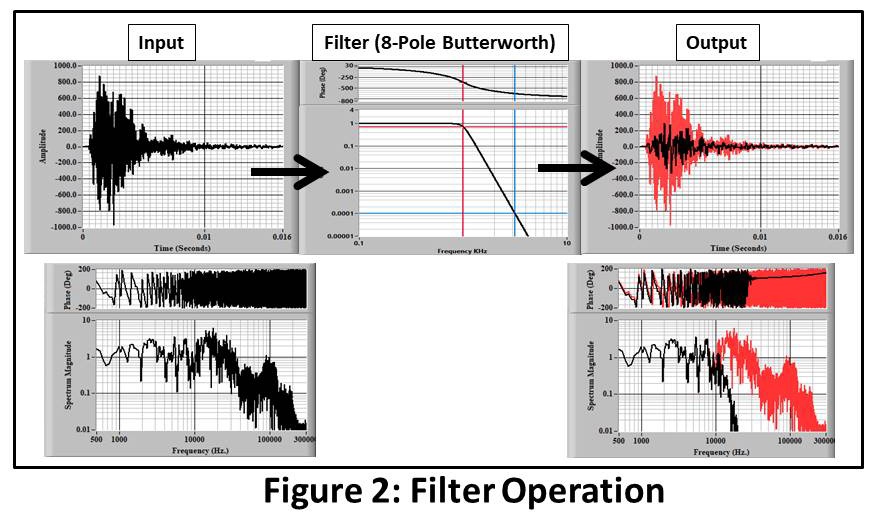
We pass a signal (Input Time History) through a filter and see what comes out (Output Time History).
- The left frames show the input time history and spectrum.
- The middle is the spectrum that defines the filter. It shows the magnitude (gain) and phase (delay) as a function of frequency.
- The right frames show the result of the process. The high-frequency components are attenuated and the output is delayed in accordance with the filter characteristic.
Different filters have different amplitude and delay characteristics. Hence, the output time history (and spectrum) will be different.
It’s a simple as that… Don’t make it hard!
Disclosure: It’s not really that simple but that’s good enough for now.
So, What's the difference Between the Filters?
Figure 3 shows the magnitude of the transfer functions of 8-pole versions of Bessel and Butterworth, an 8-pole/8-zero elliptical, and sigma-delta filter types.
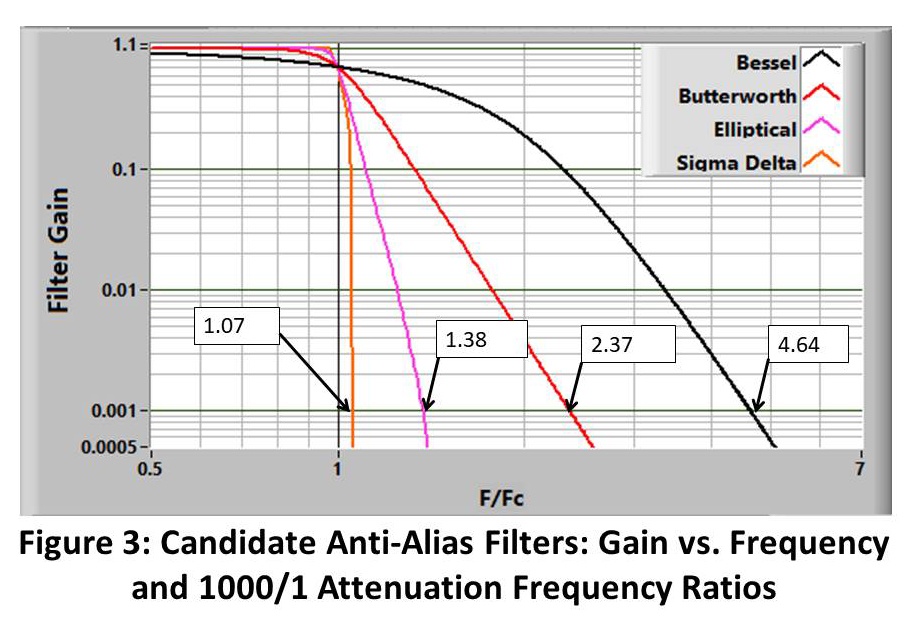
We saw a similar plot in the third blog where we were discussing the minimum sample rates for the different filters. The point made there was that the attenuation characteristics (how fast they roll off) allowed different minimum sample rates. From that standpoint, the Sigma Delta and Elliptical filters looked very good. However, that is certainly not the whole story.
Let's take a break here to ask you to join the discussion.
With any luck, I have provoked some questions and/or disagreements in these blogs.
For instance, the first blog generated a comment/question about my dislike of Bessel filters.
I think I have answered that in this entry. Send me more...
At the bottom of the page you will find ways to contact me.
Alias rejection is critical but, as we saw in Figure 1, even when the data is well protected from aliasing, the different filters give significantly-different time history results. This is because of two effects:
- Amplitude and phase distortion “In-Band” (Frequencies below the cutoff frequency FC).
- “Out-of-Band” (Frequencies above FC) energy contribution to total response.
We will tackle item 1 first.
Figure 4 shows the “complete” definition of an 8-pole Butterworth filter in its pass band (up to, and slightly above, the cutoff frequency). Note that the horizontal axis is linear.
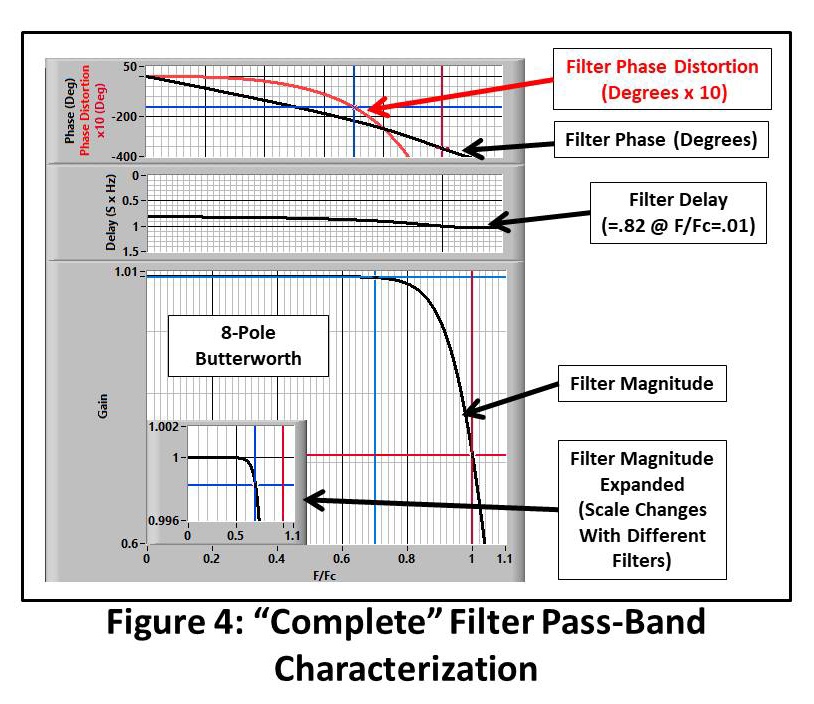
- Bottom frame:
- Transfer-Function Magnitude. We have seen that lots of times. It is the most important characteristic for alias-rejection analysis.
- The inset shows the amplitude with higher vertical resolution. When we look at the characteristics of different filters, we will adjust the vertical scale to show the in-band filter shape in better detail.
- Transfer-Function Magnitude. We have seen that lots of times. It is the most important characteristic for alias-rejection analysis.
- Middle Frame:
- The delay in seconds for a 1-Hz. filter. Find the delay for other filter cutoffs by dividing by the cutoff frequency. For example, the delay for a 500 Hz. Butterworth filter at low frequency is 0.82 / 500 = .0016 Sec.
- Top frame:
- Black: The phase (caused by the delay) of the output relative to the input, in degrees.
- Red: The “Phase Distortion”. The phase delay, relative to the ideal, of the frequency component in degrees x 10. Deviation from zero shows that components at that frequency go through the filter at different speeds than others. It is calculated by subtracting a straight line from the phase. For an “Ideal” filter, all components will pass through the filter at the same speed and it will be zero.
What Goes On Below the Cutoff Frequency?
Let’s look at the in-band characteristics for our four candidate filters (Figures 5, 6).
The Bessel filter:
- Attenuates the in-band spectrum significantly. At ½ if the cutoff frequency the gain is .91 and at .7 FC it is 0.84.
- It has “ideal” phase/delay characteristics up to the cutoff frequency. Its delay is the smallest of the filter options at .505 seconds for a 1-Hz filter.
- The delay is reflected in the phase behavior: The phase/vs. frequency curve is a straight (linear) line. The phase distortion is essentially zero.
Hence, the Bessel is called a “linear-phase/constant delay” filter. It is optimized for that behavior.
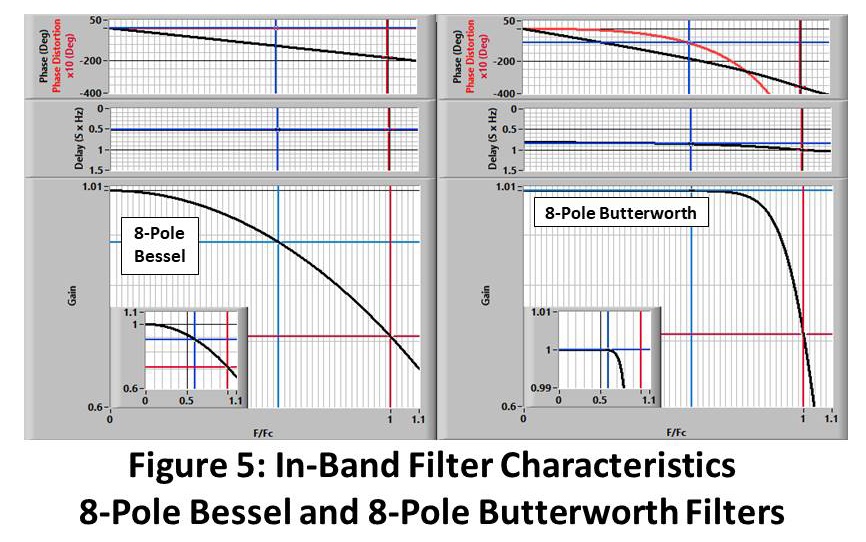
The Butterworth filter:
- Has essentially flat frequency response out to ~80% of the cutoff frequency.
- The delay is higher than the Bessel’s at 0.81 seconds at low frequency. It increases to 0.9 seconds at 0.8 FC.
- The delay behavior results in non-linear phase and consequent distortion. At 60% of the cutoff, the phase is 9 degrees later than it should be. Components at 0.8 FC lag about 26 degrees.
The Butterworth filter is optimized for flat in-band magnitude response.
The Elliptical filter:
- Has the “squarest” amplitude characteristic of the analog filter options. The gain ripples ~+25% below the cutoff but is otherwise ~flat to the cutoff.
- It also has a ~.8 second delay at low frequency. It has the worst delay variation. At .6 FC the phase lag is 16 degrees and at 80% the lag is 46 degrees.
The elliptical filter is optimized for ~flat in-band response and extremely sharp rolloff allowing lower sample rates.
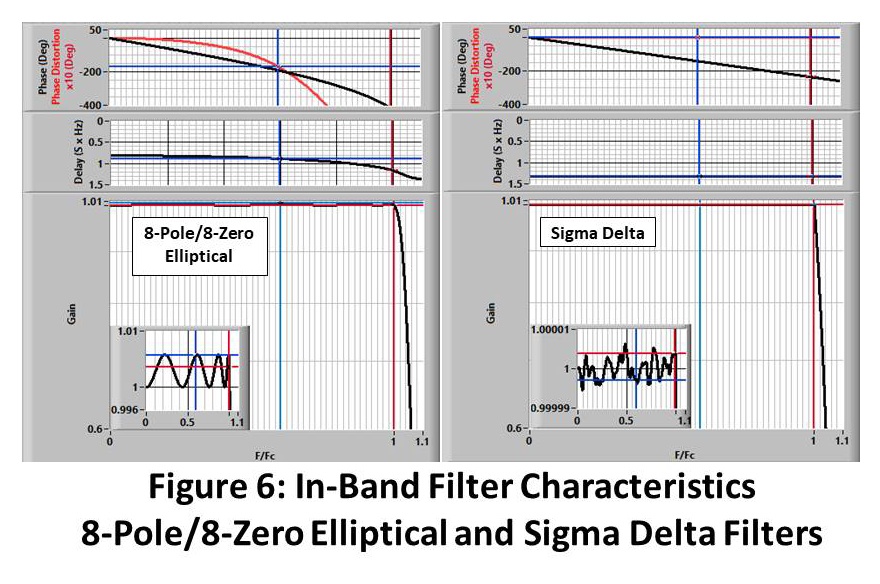
The Sigma Delta (hybrid analog/digital) option:
- Is even “squarer” than the elliptical. The gain has tiny ripples but is otherwise essentially constant to FC.
- The delay is the highest at ~1.3 seconds but is constant.
- The delay behavior produces ~perfectly linear phase. The phase distortion is ~0.
Where Does The Energy Go?
Next, let’s look at the “in- and out-of-band contribution” to total response from an energy (magnitude2) standpoint.
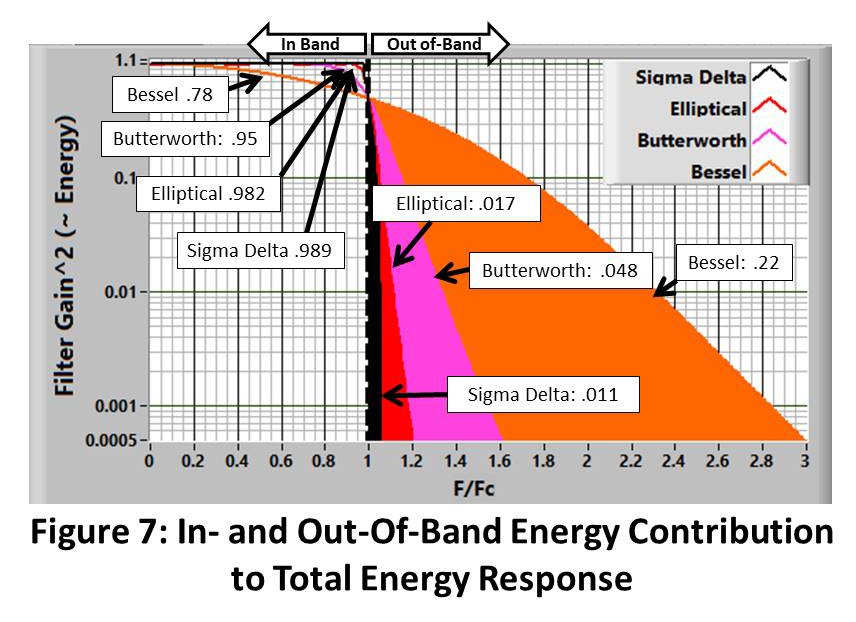
Figure 7 shows the spectral energy response of each of the filters. Each curve is labeled with the ratio of the out-of-band area to the nominal input area.
An “ideal” filter would produce an in-band response ratio of 1 and an out-of-band ratio of 0.
Deviations from the “Ideal” response are errors if we don’t correct for them later. (We will talk about that in a future blog).
Let’s see what happens to our real shock signal (Figure 8).
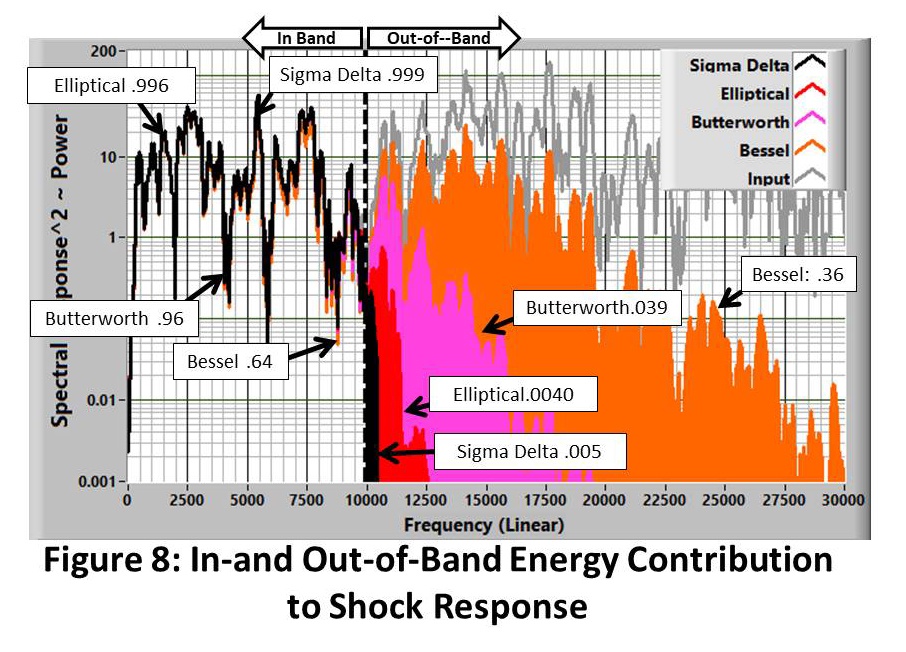
What we see in both the raw filter characteristic and the shock results is that:
- The Bessel filter significantly underestimates the in-band response and overstates the out-of-band contribution.
- The Butterworth filter does a pretty good job with both in-and-out-of-band results.
- The Elliptical and Sigma Delta options do a great job on both.
The results for this shock time history are biased toward out-of-band because the signal has significant energy above the cutoff frequency. This is not the most common case but it certainly can happen.
We started with the 10 KHz. cutoff in the first blog and we are sticking with it!
Next, Let’s Look at the Response to a Signal We Understand!
One of my favorite test signals is a square wave. If you drive your system with a square wave generator or simulate it, as we are doing here, you can learn a lot about your system.
Figure 9 shows the time-domain response of our candidate 8-pole, 10KHz, filters to a square wave input.
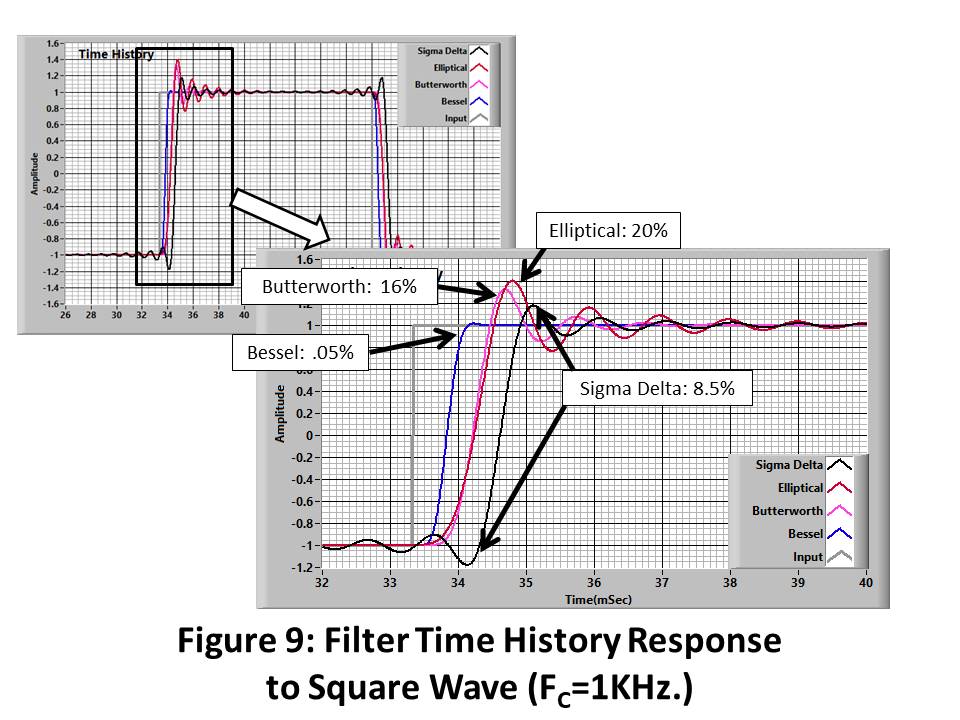
Bessel:
- Has essentially zero overshoot. That was one of the design objectives.
- Has the smallest delay.
Butterworth:
- Overshoots about 16% of the transition.
- Has a larger delay.
Elliptical (this particular one)
- Overshoots 20%. (Note that different elliptical filters will have different overshoots).
- Has delay about the same as the Butterworth but has a slightly different characteristic.
Sigma Delta
- Is weird (Well, it is primarily a digital implementation.. What do you expect?):
- Has “overshoot” both at the beginning and end of the transition. This is a characteristic of the digital Finite Impulse Response (FIR) filter used to do the low-pass operation. (This is discussed in a future blog).
- Although this is the sharpest of our filter options, the overshoot is only 8.5%. This is because the transition/overshoot energy is divided between the beginning and the end of the transition. This is a real advantage.
- Has the longest delay of the options.
What Anti-Alias Filter Do You Have?
I hope that I have made it clear that it is critical that you know the characteristics of your system. Here is a simple test: Do the same thing that I have done analytically here. Hook up a square-wave generator and set the amplitude of ½ of full scale and the frequency to 10% of the bandwidth. You should get a response like one of the colored curves in Figure 9.
--------------
What you don’t want to see is a square wave (the gray/Input) waveform in the figure. That indicates that you don’t have a filter! Most digital oscilloscopes don’t have a filter..Beware!
…And, What Happens to Peaks?
It took me some thinking to conjure up a test that would show the combined effect of the filter attenuation and non-linear phase. This is what I came up with:
Let’s look at a peak in our input time history. Ideally, when we put it through a low-pass filter, if its frequency is below the cutoff frequency, it will pass through delayed but otherwise unaffected.
However, if the filter gain and/or the delay is not constant the peak will be attenuated.
The error due to gain is obvious: Error = 1 – Gain.
The error due to Non-Constant Delay is Error = 1 – cos (Phase Distortion), the red curves in Figures 4, 5, and 6.
These, and the sum (Total Error) are plotted for Bessel, Butterworth, and Elliptical filters in Figure 10.
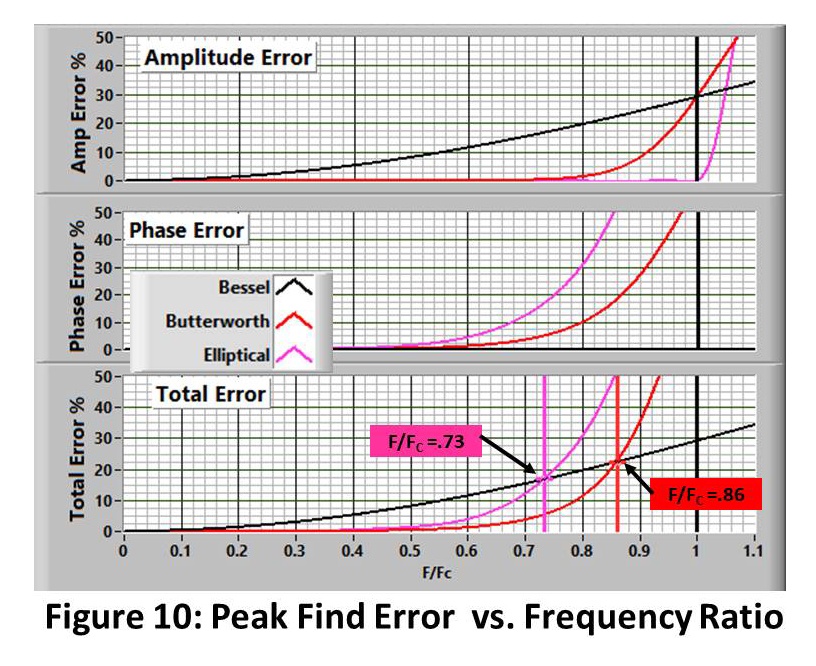
What we see is:
- At low frequency (below 0.5 FC), the Butterworth and Elliptical Filters produce the same “~perfect” results.
- Up to 0.73 FC, the Elliptical option is better than the Bessel.
- Up to 0.86 FC, the Butterworth filter is better than the Bessel.
- Above 0.86 FC the Bessel Filter is best.
So, it depends on what frequency components are in your experiment. For the majority of applications, most of the energy is below 0.5 FC so it’s a wash between Butterworth and Elliptical. Up to 0.86 FC, the Butterworth looks better. In the unlikely case that most of the energy is above FC, the Bessel is the better choice.
I haven’t plotted the results from a Sigma Delta system because they are essentially perfect!
Which Filter is Best for Your Application?
So far, I have presented a view of the filter characteristics and tried to keep my opinions about the optimum choice for a given application to myself. The fact is that all of these filter options cause some distortion (error?) in the output. The distortion appears in both the amplitude and phase of the transfer function and the different filter concepts provide a different mix.
Conventional wisdom:
- Bessel is best for:
- Transient signals (shock, lightning strikes.. short-duration events entirely covered by the data selected).
- Where the time-domain representation is most important.
- Butterworth is best
- For “continuous” signals (noise, vibration.. other “long” waveforms).
- Where the spectral-domain representation is most important.
- Elliptical is best when sample rate is restricted by hardware capability.
- I guess that Sigma Delta is too new to be characterized. My spin: It’s just plain best from all standpoints.
My spin:
- Bessel: I am hard pressed to find any redeeming features. None of the “tests” that I have done make it look like a good choice. Simple as that!
- Butterworth: If you have to use an analog filter, this is my choice for most applications.
- In all of my tests it behaves well out to 0.8 FC, covering most of the response in most applications.
- I am willing to accept the 16% overshoot that I get from a square wave. Any “real” signal will have less overshoot. Also, I want a conservative result so, if the time history is a little high, that is OK.
- Elliptical: Might be used if your sample rate is really restricted. It’s only significant fault is the large overshoot. I was surprised how well it did in the peak modification test. It’s non-linear-phase characteristic has gotten a bad rap!
- That leaves Sigma Delta. What’s not to like? Flat frequency response to the cutoff, extremely sharp cutoff, linear phase/constant delay and lower overshoot than any except the Bessel.
This discussion has primarily been intended to discuss the effects of filtering on the time history. For users primarily interested in spectral results (Fourier spectra, PSD, shock response spectra, octave analysis…) any of the filters except Bessel will do well.
Sigma Delta is my choice for (almost) all applications. Where won’t it work?
- Applications like time-domain feedback control applications. The long delay is a killer.
- Low-frequency applications. The available Sigma Delta converters are not good below a few hundred samples/second.
- Very high-speed: The fastest high-quality Sigma Delta system that I know of samples at 5MS/S and has a 2.3 MHz. bandwidth. This will obviously improve in the future.
25 years ago, when the first commercial Sigma Delta systems hit the market, I predicted that this technology would completely replace analog filters for audio-frequency applications within the next 10 years. That prediction has proven to be wildly optimistic. However, it is happening. Pure analog filters will disappear!
Filter "Transfer Function Compensation"
What if we don’t like the result that the filter system that we have provided? In a later post, I will describe the process that you might use to make data acquired with one filter (Bessel?) filter look like it was acquired with another (Butterworth, Sigma Delta?). For instance, if you are lucky enough to have a sigma-delta-based system, you might want to make your results look like it was acquired by your older system for an apples-apples comparison.
Finally....
I have applied the tests that I know of that explore the behaviors of low-pass filters that might be used for alias protection. Do you have others?
What is your spin on this? I want to hear it.. So do all the other readers.
Send a Comment or Question to Strether

One of the reasons I've been writing these blogs is to get a discussion going. Please reach out to me with any questions or comments you may have.
You can participate by:
- Entering comments/questions below in the Comments Section at the end of the blog. This will obviously be public to all readers.
- Contact me directly. I will respond privately and (hopefully) promptly. If appropriate, your question could be the subject of a future blog.
This blog is meant to be a seminar... not a lecture. I need your help & feedback to make it good!
Disclaimer
Strether has no official connection to Mide or enDAQ, a product line of Mide, and does not endorse Mide’s, or any other vendor’s, product unless it is expressly discussed in his blog posts.
Additional Resources
If you'd like to learn a little more about various aspects in shock and vibration testing and analysis, download our free Shock & Vibration Testing Overview eBook. In there are some examples, background, and a ton of links to where you can learn more. And as always, don't hesitate to reach out to us if you have any questions!