This guest post was written by Luke Saindon of bluShift Aerospace. Luke is a former employee of Mide Technology (enDAQ is a division of Mide). bluShift wanted to understand how much the final version of their hybrid rocket engine vibrated. Using an enDAQ sensor, bluShift was able to get a clearer understanding of vibration in their rocket engine.
At bluShift Aerospace we’re a tight knit team of engineers who are trying to develop a new launch vehicle to serve the nanosatellite community. Part of that work has involved our team developing a new rocket engine that will fit our needs. Rocket engines are difficult beasts to get right, and bluShift is taking on the additional challenge of designing a somewhat lesser-known type of engine called a hybrid. Hybrid rocket engines burn liquid oxidizer within a solid fuel grain (sometimes the oxidizer is solid and the fuel is liquid, but much that’s much less common). In January 2021 bluShift successfully flew a rocket for the first time with this particular engine, but that’s another story.
As we began developing these hybrid rocket engines, we needed a clear picture of the vibration coming from the rocket engine. This post details how we used enDAQ sensors and software to measure the vibrations on the final version on our rocket engine. The data set analyzed in this post is available at the end to download and do your own analysis on.
In this post, I'll go over:
- Vibration Issues in Hybrid Rocket Motors
- Measuring Vibration on a Rocket with enDAQ Sensors
- Data Analysis and Findings
- Conclusion
Vibration Issues in Hybrid Rocket Motors
Some of the issues with hybrid rocket motors are that they vibrate a lot and are prone to unstable combustion which makes the thrust and pressure vary during the burn.
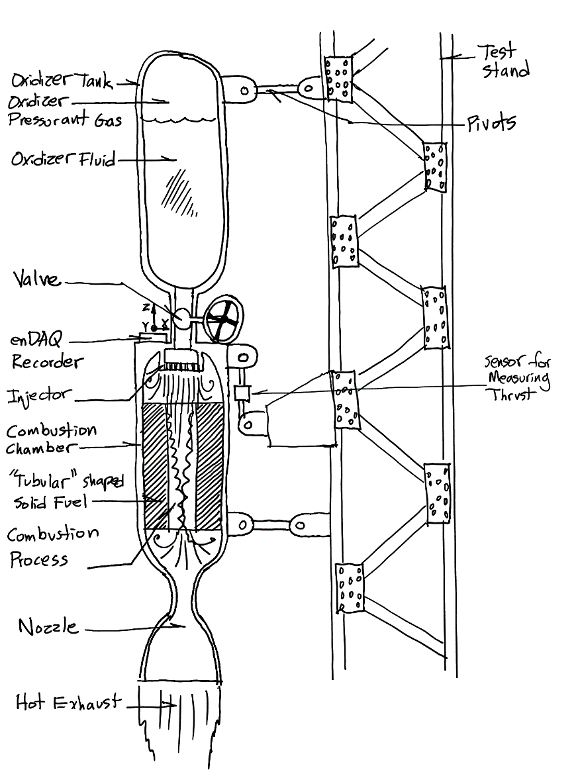 Figure 1. Illustration of a hybrid rocket engine
bluShift needed a clear understanding of the vibration coming from our rocket engine. Too much vibration could transmit through the rocket airframe and cause all sorts of problems structurally, electrically, and for customer payloads. The following two plots show how violently a hybrid rocket engine’s internal pressure can fluctuate during unstable burning. These fluctuations lead to variations in thrust and vibrations in the combustion chamber walls, both of which transmit to the rest of the rocket and wreak havoc. The second plot, Figure 3, shows the same engine later on in development, and how the pressure oscillations have been tamed.
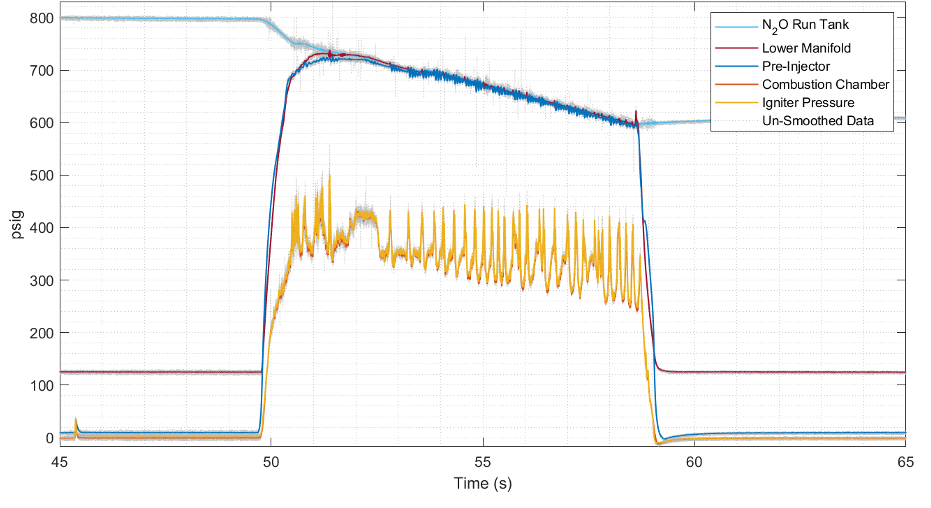
Figure 2. An example of an unstable rocket engine burn. The yellow line is the oscillating pressure inside the combustion chamber.
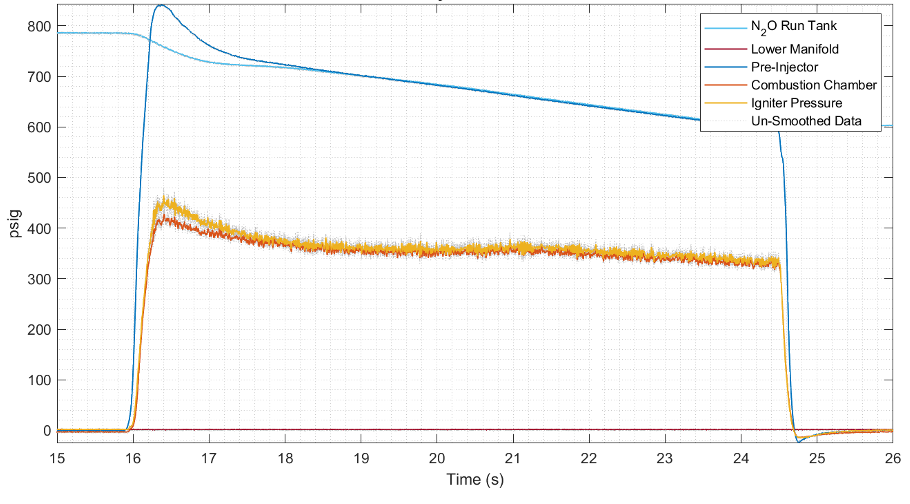
Figure 3. An example of stable rocket engine burn. The relatively smooth yellow line shows a steady pressure inside the engine. bluShift still needs to understand how much vibration these remaining small pressure fluctuations cause.
bluShift wanted to understand how much the final version of the rocket engine vibrated, so that we could tell our customers what to expect their payloads on our rockets to experience.
Measuring Vibration on a Rocket with enDAQ Sensors
bluShift mounted enDAQ’s sensor on the upper bulkhead of the combustion chamber (see Figure 1), this would be the area experiencing the worst vibration because it acts like a drumhead as the pressure in the combustion chamber fluctuates.
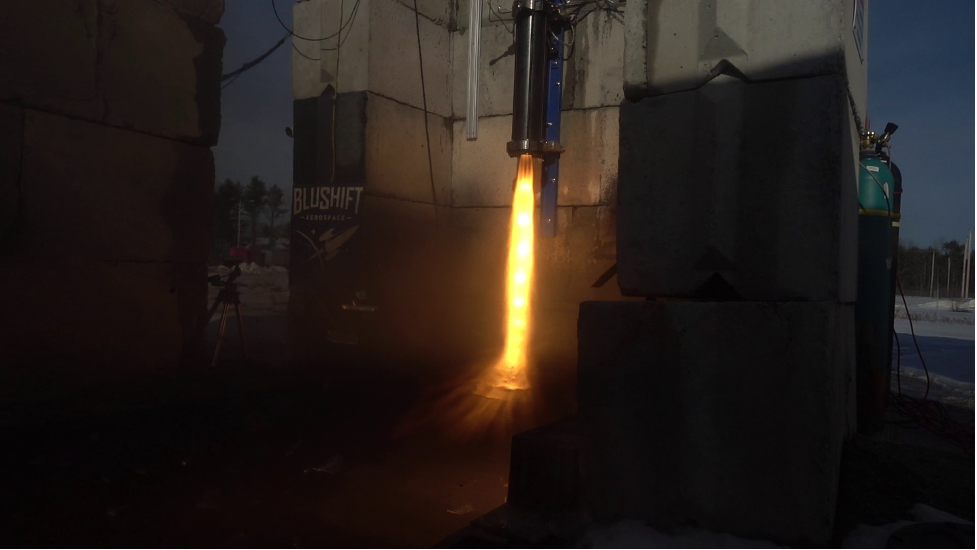
Figure 4. A picture of bluShift’s hybrid rocket engine running
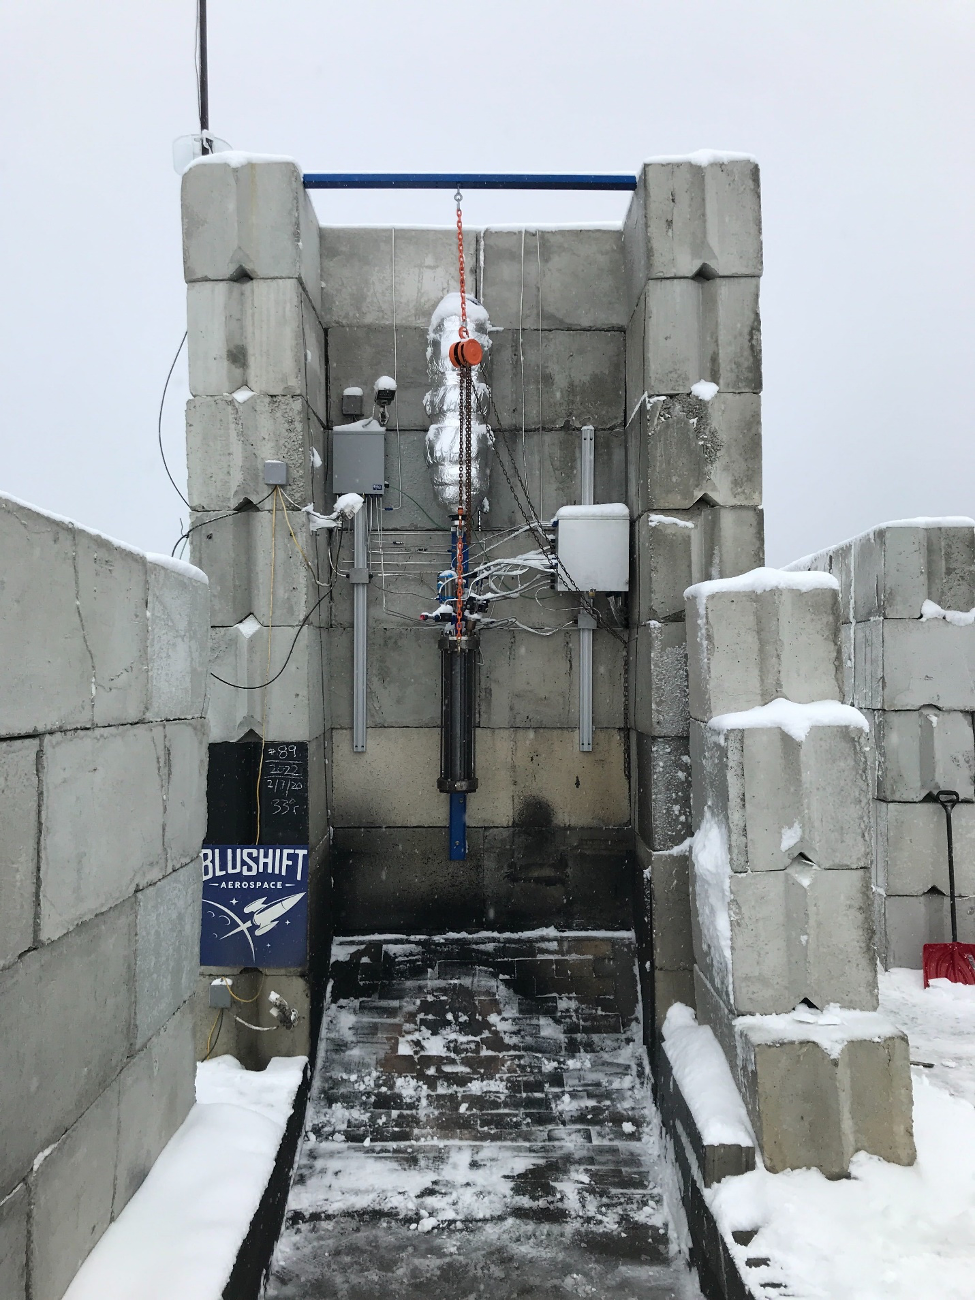
Figure 5. The bluShift rocket engine sitting on the test stand, waiting to be fired
The enDAQ sensor was bolted, using the three 4-40 screw holes, directly to the stainless-steel upper bulkhead of the rocket engine. enDAQ provides trigger functionality on the recorder, which bluShift used to maximize storage space and battery life. Functionality for up to 20 kHz recording is available, but bluShift knew that the worst vibrations would be in the 400-700 Hz range, so sampling at 5 kHz still kept us well above the Nyquist frequency.
Data Analysis and Findings
bluShift was very pleased with how “gentle” the vibrational environment actually was on the final motor, albeit the considerable mass of the “heavy duty” test engine likely contributed to this smooth ride. Figure 6 shows peaks of only 7.5-8 g’s. This figure and the rest are rendered with the Plotly library which lets you interact (zoom, pan, click on/off variables in the legend) with the plots right here in the web browser!
Figure 6: Raw vibration signals in z-axis (aligned with axis of rocket motor)
Clearly the raw signal is of limited use, and looks like a big jumble that’s hard to glean much information from other than peak acceleration. It leaves the user wondering whether these peaks actually contain much energy, and at what frequencies the most damaging vibrations are occurring. A simple drop onto a hard surface can cause much higher accelerations, but the area under the curve is so small that very little energy is actually transmitted (i.e., the shock duration is very short and therefore not much deflection in structure occurs, see Midé’s harmonic motion calculator).
One of the most valuable features of the enDAQ recorder is the suite of analysis tools that it easily interfaces with, including enDAQ Lab and the VibrationData Toolbox. These can generate the plots shown here although the specific plots were generated with Python code the enDAQ team is readying for public release.
One of the first analyses that can be done is a fast Fourier transform or FFT, which shows the same signal in the frequency spectrum. A FFT can be performed for the whole sample time, as shown in Figure 7.
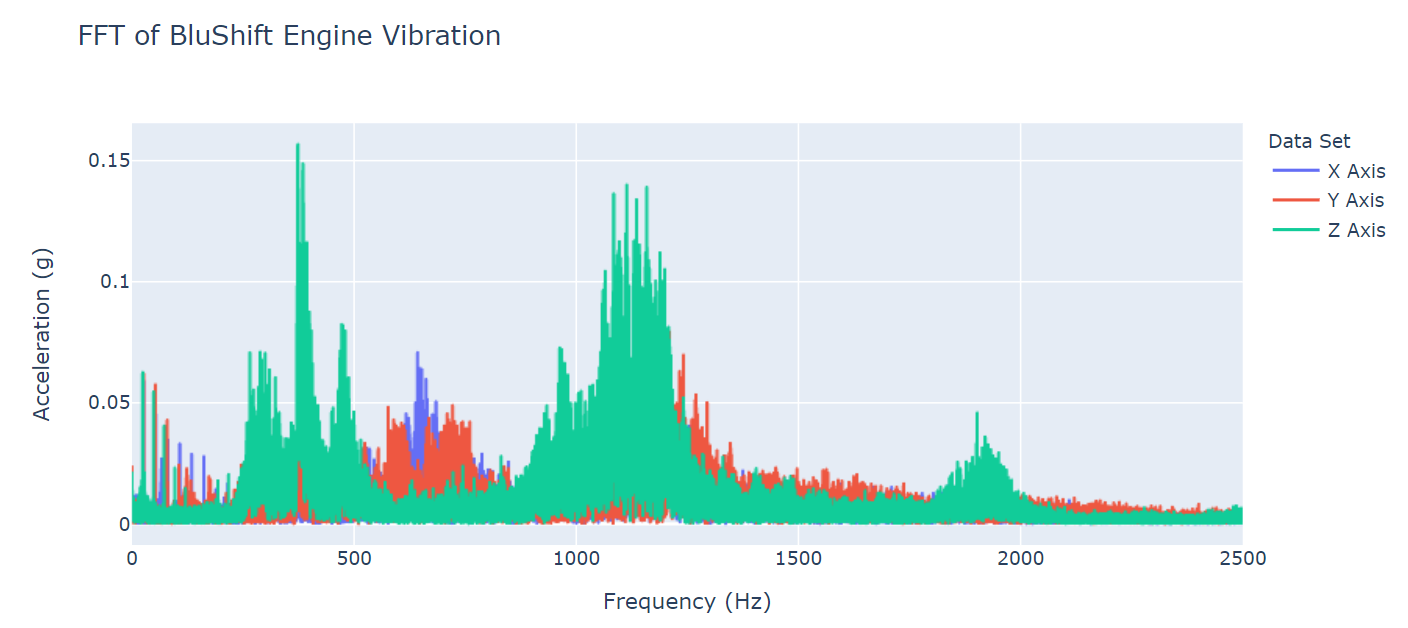
Figure 7: Fast Fourier Transform (FFT) of the entire sample duration
The trouble of doing an FFT over the entire time sample on a changing signal is that it we can't see how the frequency content may have changed over time. To display this information you can create what's called a waterfall FFT which will plot a series of FFTs for equally spaced shorter windows that gets slid over the sample period, like Figure 8.
Figure 8: Waterfall Fast Fourier Transform (FFT) of the entire sample duration
Another way to see how frequency changes over time is to generate a “spectrogram” which is a heatmap showing how the dominant frequencies are changing over time in an appealing visual way. This is provided in Figure 9. All of these FFT’s are easily made with enDAQ Lab and the VibrationAnalysis Toolbox.
Figure 9: FFT Spectrogram, showing shifts in frequency over time
Some vibrations, like bluShift’s here, are somewhat random “noise." For this type of data an FFT is not always the most illuminating. Other analysis methods, such as power spectral density plot (PSD), can be more useful. Figure 10 shows such a PSD analysis. A power spectral density analysis reveals which frequency ranges carry the most power, not just which frequencies dominate the Fourier transform, and therefore which frequencies a customer on a bluShift rocket might need to be most wary of. In this case it looks like the spike around 400 Hz or 1200 Hz is the most damaging. Sometimes the highest spike in a FFT will not be the highest in a PSD and, therefore, if a user simply relied on the FFT they might be drawn to harden their system against the wrong frequencies of vibration.
Figure 10: A power spectral density (PSD) plot of the sampled time duration, showing which frequencies carry the most power.
Finally, another plot that the VibrationData Toolbox makes easy to generate is a cumulative RMS (Figure 11), which takes the results from a PSD and cumulatively adds (integrates) the power at each frequency to gain insight into which frequencies contribute most to the overall vibrational energy fingerprint. This plot is useful here because the PSD spike at 400 Hz doesn’t necessarily look as severe as the spike at 1200 Hz, but the cumulative RMS reveals that it is much “denser” and therefore actually contributes the most energy to the environment. This manifests as a quick rise in the trendline from 200-500 Hz.
Figure 11: Cumulative RMS of the vibration sample, areas which rise the quickest show the frequency ranges that contribute the most energy to the overall vibrational environment
Conclusion
From using enDAQ's sensors and software to measure vibration in the final version of our hybrid rocket engine, we were able to get a clearer understanding of the vibration coming from our rocket engine and are able to tell customers what to expect their payloads on our rockets to experience.
If you would like to view and analyze this data directly yourself, the raw .IDE file generated by the enDAQ sensor and the .CSV file of the exported accelerometer data is available to download.
Related Posts:
- How to Develop a Vibration Test Standard PSD from Experimental Data
- Understanding the Basics of Fourier Transforms
- Vibration Analysis: FFT, PSD, and Spectrogram Basics
About bluShift Aerospace
bluShift Aerospace is looking at rockets like no one has before, by integrating multiple innovative technologies for the first time in one motor. Not only does their approach increase performance by using a sustainably farmed, bio-derived fuel, but that fuel also mitigates the detrimental impact on the environment that traditional liquid and hybrid rocket motors can have.
bluShift Aerospace's team is small and their ambitions are big, helping to keep the cost of development down. They’ve optimized the fuel, developed a test rocket engine, and launched a sub-scale path finder vehicle that demonstrated the bio-derived fuel in a commercial setting as a world first. bluShift if now working on full scale suborbital launch capabilities for our customers followed by orbital launches in the future.
Visit bluShift Aerospace's Website