How do we summarize shock analysis in less than 1 sentence? Don't pay attention to peak acceleration, instead focus on the pseudo velocity shock spectrum (PVSS).
Now for a bit more: in the video above, I provide a 5 minute (or close to it!) overview on shock analysis, and below I'll keep it short and sweet. For a deeper dive, see our related post: Shock Analysis: Response Spectrum (SRS), Pseudo Velocity & Severity.
To summarize shock analysis, let's answer the question on how we would compare different shock events?
- In the time domain
- With a shock response spectrum
- With a pseudo velocity shock spectrum (PVSS)
- In terms of severity
Then we'll conclude by making that comparison with a PVSS which effectively does all of the above in one plot!
In the Time Domain
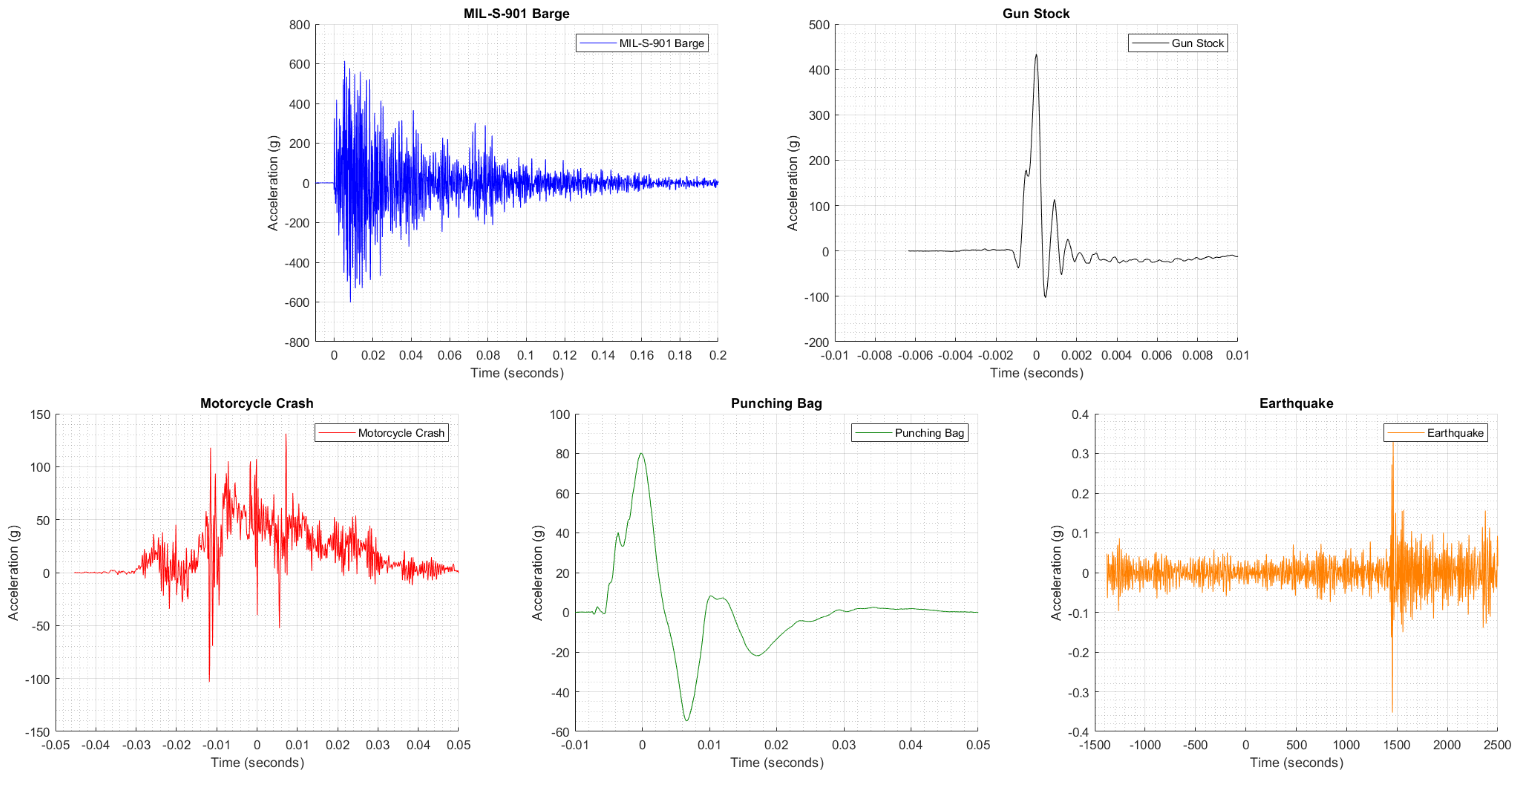
Let's look at real shock data (which can be freely downloaded) from the following 5 events:
- Motorcycle crash with a car
- Human hitting a punching bag
- Earthquake
- MIL-S-901D (military standard for shock testing of equipment on Navy ships)
- Recoil of gun stock during firing
Plotting them all in the time domain is shown below, but we can see how dissimilar the events are which makes the comparison difficult!
 If you must compare shock data in the time domain, low-pass filtering is your friend! Here is the raw data from the motorcycle crash.


Takeaways from the time domain:
- It is difficult and often misleading to compare different shock events in the time domain
- But if you must, use low-pass filtering
The Shock Response Spectrum
The shock response spectrum (SRS) calculates and defines how a single degree-of-freedom system with different hypothetical natural frequencies would respond to the shock.
First, here is the acceleration response in the time domain to the motorcycle crash input for three different natural frequencies: 10 Hz, 100 Hz, and 1 kHz. And we've called out the peak acceleration in each one of those frequencies experiences.

The acceleration shock response spectrum will loop through many frequencies to calculate and plot these responses. We can see which frequencies are isolating the input and which are amplifying it and use that to inform our design decisions.

Now we do the same with the relative displacement between an input pulse and the response of a system.

Now here is the relative displacement shock response spectrum (looping through many natural frequencies). Again we can use this information in our design if we choose to use an isolator, it will need to withstand the relative displacement to successfully isolate!

Takeaways from the response spectrum:
- SRS helps quantify and compare how systems with different natural frequencies respond to a shock
- SRS gives you actionable information
Pseudo Velocity
Now we bring it all back together and show the pseudo velocity shock response which gives us the other metrics (acceleration and relative displacement) in one plot! This is calculated by taking the relative displacement and multiplying by wn for pseudo velocity, and then again for the acceleration (which is an approximation for acceleration but a good one).

Because of this linear relationship between relative displacement, pseudo velocity, and approximated acceleration, we can use diagonal lines to show the other metrics on the one plot!
Below is a comparison of the pseudo velocity shock spectrum (PVSS) for different levels of damping. As damping is reduced, that plateau in the PVSS starts to approach 677 in/s.

Now here is taking that raw acceleration data and integrating it to get the velocity change from impact. Notice how the final velocity change is within 1% of the plateau from the PVSS!

Takeaways from pseudo velocity:
- It provides 4 metrics in one plot (pseudo velocity, relative displacement, approximate acceleration)
- The peak pseudo velocity will approximate the total change in velocity from the impact
What is a Severe Shock?
The energy in a shock event is the area under the curve. Stress is proportional to modal velocity, not g's or acceleration. From equation 16 in Gaberson's paper:
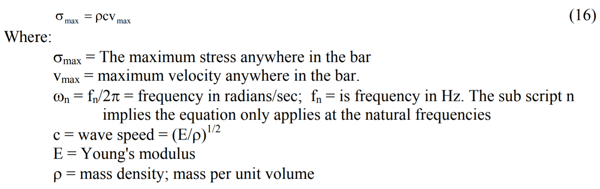
We know stress limits for materials and therefore can calculate the maximum velocity for these materials. Here are the maximum velocities for several materials provided by a paper by Gaberson on Shock Severity.
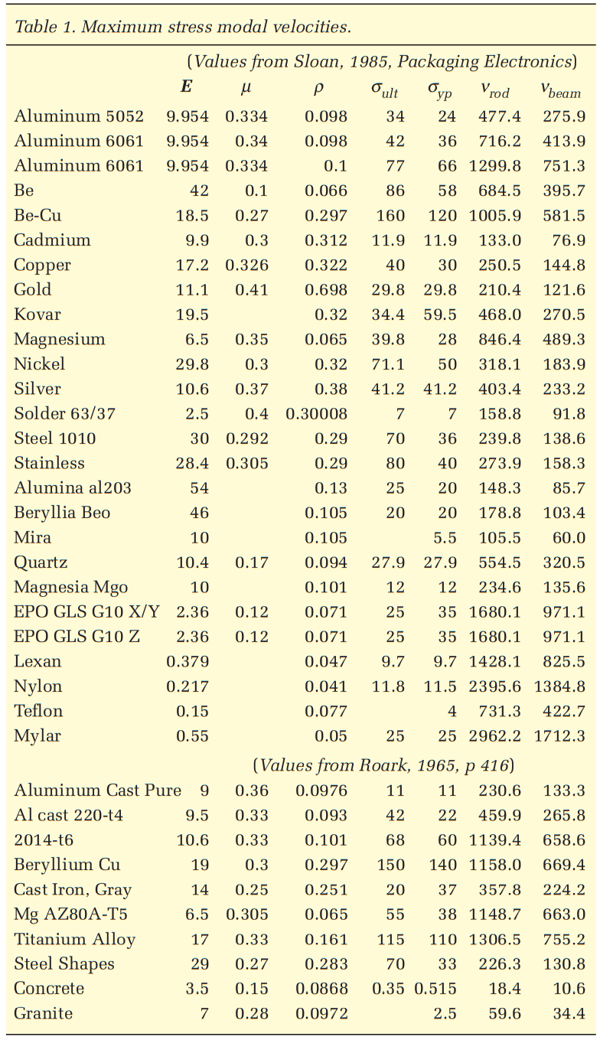
Notice how there is a velocity value for each material at which it starts yielding and some of these approach 100 inches per second (ips) in the case of steel.
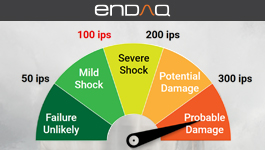
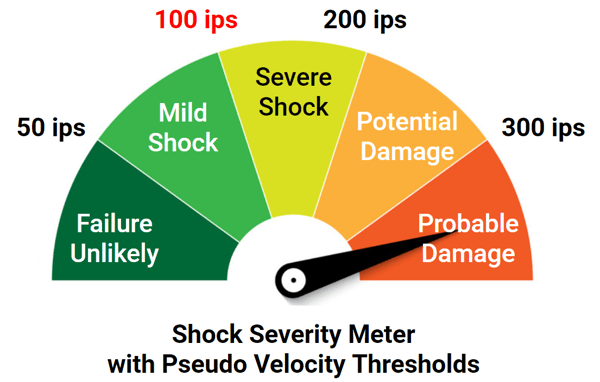
In addition to Gaberson and others, we've seen military standards (such as MIL-STD-810E and SMC-TR-06-11) specify shock severity in terms of velocity. In general the 100 inch per second (ips) threshold for pseudo velocity is used in industry as that threshold for defining a "severe" shock. This severity can be summarized in the following rule-of-thumb gauge.
Takeaways of shock severity:
- Stress is proportional to modal velocity, not peak acceleration
- A peak pseudo velocity of greater than 100 in/s (254 cm/s) is considered severe
Comparison of Events with PVSS

So let's get to the main event and calculate and compare the pseudo velocity comparison of these events, which you can see in a simple and clean single plot.

All of these events are "severe" shocks or greater, surpassing the 100 ips pseudo velocity threshold. But believe it or not, the earthquake is the most severe logging a maximum pseudo velocity of about 1,000 in/s! Yet, the maximum acceleration amplitude in the time domain was 0.3g. Clearly, "max g" or peak acceleration is a misleading way to characterize a shock event. And it shouldn't be all that surprising when we remind ourselves that earthquakes are capable of toppling buildings.
Conclusion & Additional Resources
If there can be two things to take away from this post:
- Characterizing a shock analysis based on the peak acceleration value is effectively useless and misleading
- Pseudo velocity is a much more effective metric to characterize a shock event, especially with the full shock response spectrum
Expanding upon why pseudo velocity is the best! There are a few advantages:
- Proportional to dynamic stress which in effect measures severity
- Maximum pseudo velocity is the impact velocity or velocity change that took place during the shock (which is why there is often a plateau)
- Easy to calculate and approximates the relative velocity which isn't easy to calculate
- More condensed view compared to acceleration SRS or relative displacement SRS
- Can infer the acceleration SRS and displacement SRS from the one plot of pseudo velocity shock spectrum (PVSS)
But don't just take me at my word, download the data used in this post or go measure your own data and do your own analysis!
Please don’t hesitate to leave a comment or contact us directly with any questions you may have on this topic or others. We are here to help you with all your testing needs!
Related Posts:
- Shock Analysis: Response Spectrum (SRS), Pseudo Velocity & Severity
- Rating My Top 11 Vibration Data Loggers
- Accelerometers: Taking the Guesswork Out of Accelerometer Selection
For more on this topic, visit our dedicated Shock & Impact Sensors and Loggers resource page. There you’ll find more blog posts, case studies, webinars, software, and products focused on your shock testing and analysis needs.