This post was written in partnership with Queen's University in Kingston, Ontario. Using an enDAQ sensor from our Unit Donation Program, Keegan Franks explored how accelerometers can be used in directional drilling to determine properties of surrounding rock based upon an analysis of the vibrations.

As a student in my fourth year of Engineering Physics at Queen’s University, I decided to write my thesis exploring the various forms of measurement in directional drilling. By refining current sensors or researching unused methods, the accuracy and efficiency of directional drilling processes can be improved. This could lead to potential increases in production in a shrinking market, while also decreasing risk for large petroleum companies.
In this post, I'll cover:
- Sensors in Drilling
- Design of Drilling Experiment
- Simulation of Drilling Experiment
- Findings and Conclusion
Sensors in Drilling
First, a study of the current drilling measurement technology was performed, allowing for a detailed understanding of the limitations and strengths of the industry standard. Following this, a study on potential sensors was conducted. This included topics such as: spectrometry, fiber-optic sensors, muon imaging, and micro electronic devices. However, due to their novelty, these topics were not pursued.
Accelerometers were decided upon as a sensor that warranted more exploration. The use of accelerometers to identify geological properties was first investigated in the 1980s. The idea was quickly abandoned, however, due to advancements in more promising areas like gamma or neutron logging. Accelerometers are used in modern drills, but for monitoring of the drill bit health. They are very accurate and provide good information about how the drill bit is performing. Because the drill bit acts differently depending upon the type of material it is boring, it should be possible to determine properties of the surrounding rock based upon an analysis of the vibrations.
Design of Drilling Experiment
Following the decision to use an accelerometer as the sensor, a procedure for analysis needed to be created. Wavelet analysis is like the Fourier analysis, but more useful in this scenario as it allows for one to know at which time certain frequencies arise. Using the accelerometer and wavelet analysis in tandem would ideally allow for one to determine various properties of the material being drilled through, simply by measuring the vibration at the bit.
The accelerometer is fixed near the drill bit and collects vibrational data throughout the drilling procedure. This frequency data is then passed through a wavelet transform, allowing for more visualization and manipulation. For example, if the frequency of the spinning bit is known, it could be filtered out, reducing the noise of the signal so that only vibrational data from the material is present. The resulting signal can then be studied for differences in intensity to determine the type of material or location of any outstanding events, such as impact or cracking of the bit.
Simulation of Drilling Environment
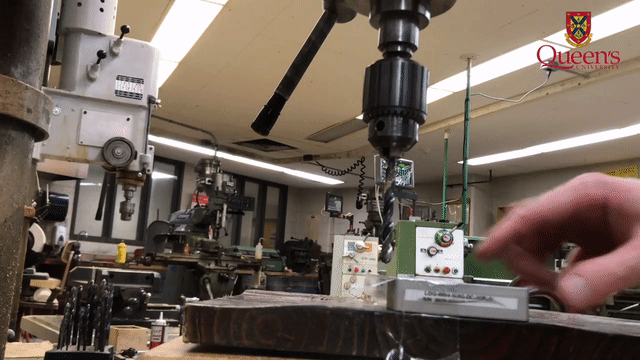
An experiment was performed using a drill press and layered wood to simulate a drilling environment. An enDAQ accelerometer was obtained and was attached to the drill or placed on the wood. Both positions had similar results. The drilling procedure was videotaped so that it could be compared to the analysis, and any specific events would be recorded.
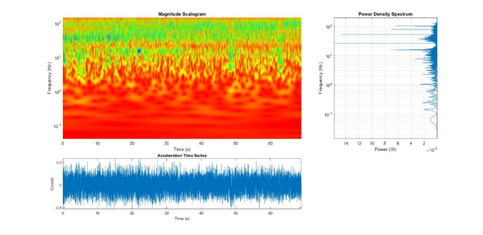 |
Figure 1. Wavelet scalogram of the vibration signal after performing a first analysis
Figure 1 presents an example of the wavelet scalogram used in analysis of the vibration signal from the wood experiment. Through previous experimentation the dominant drill frequencies have been found and filtered out, leaving a less noisy signal. The bottom plot shows the vibration data as a time series and does not reveal much about the drilling procedure. However, the colored plot shows the wavelet scalogram, and despite being quite noisy, reveals more about the experiment. There are three pronounced frequency shifts at 5s, 50s and 60s. Additionally, at 23s there is a clear blue spot, indicating a localized incidence of a frequency.
The data is now compared to the video of the experiment to see if the variations in frequency can be identified. From the video, the drill enters the wood at 6s. The wood is drilled normally until 40-45s where there is some loud squeaking. At 50s the drill reaches the bottom of the wood and is pulled back out. At 60s the drill is free from the wood and the sensor turned off shortly after. All these instances can be seen in the wavelet scalogram except the change in sound from 40-45s. This shows the accelerometer can measure the difference in vibration when the drill is in the wood, compared to when it is freely spinning.
|
|
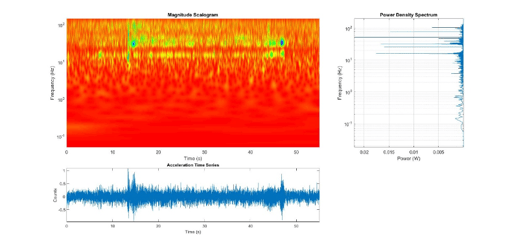
Figure 2 shows a second trial for the wood experiment. The same filters have been applied as with the first case, with the frequencies of 24-26Hz, 48-50Hz and 84-86Hz removed. This trial is of note for two reasons. During the drilling process, the wood plank split at approximately 12s. This split is clearly visible as the first green and blue spot on the magnitude scalogram. The second green spot can be correlated to when the drill punched through the bottom of the wood. This occurred at approximately 45s with the bit being pulled out and fully removed from the wood at 50 seconds.
Conclusion
From these tests it can be concluded that an accelerometer can be used to discern between drilling material as well as show key events. From the first test, it is evident when the drill is inside the wood, compared to when it is not. To actively discern between rock material, some kind of calibration is necessary. With many other drilling sensors, a test pit of known rock types and thickness is used. The sensors can then be calibrated using this controlled data. This would be useful with an accelerometer to determine the intensity of vibration in specific rock, with specific drill bits.
From the second test, the accelerometer can accurately measure key events. In the case of the wood experiment, this was shown by the splitting of the board, but in a real drilling scenario this could correspond to an impact, or some damage to the bit.
Clearly, there is potential for accelerometers to be used in directional drilling or for the determination of rock properties. At the culmination of this thesis they are unable to be used effectively for anything but the identification of some key events. However, with a more rigorous wavelet analysis and further calibration in test pits they could be used for much more.
About the Author
Keegan Franks (BASc, 2020) graduated in Engineering Physics in 2020 from the Department of Physics, Engineering Physics and Astronomy at Queen's University. For his final engineering thesis project, he investigated the use of accelerometers (mounted on a drill assembly) to predict changes in lithology while drilling. The applications of such a method would benefit oil and gas exploration and production.
Alexander Braun is a Professor of Geophysics at Queen's University, and served as the supervisor of the project. His research ranges from applied geophysics, satellite remote sensing, unmanned aerial vehicles to the search for lunar lava tubes. He also operates a superconducting gravimeter which is sensitive to 1 part in 20 billion, a pretty decent accelerometer.
Related Posts:
- Vibration Measurements: Accelerometer Basics
- Piezoelectric Accelerometers: Mysteries on How They Work... Revealed!
- Understanding the Basics of Fourier Transforms