Have you ever had two sensor signals measuring different parts of a common system? It can be a real pain to synchronize these signals in post processing if they hadn’t been measured by the same data acquisition system. They are likely to have slightly different sampling rates and clock times that require an offset.
Our sensor customers often need to synchronize these self-contained data acquisition and sensing tools across multiple devices. For one customer, synchronization was so important that we worked with them to develop a solution to synchronizing two signals that I want to share with you in this blog. I’ll cover:
- An example of misaligned data that needs synchronization
- Hardware necessary to perform the synchronization (spoiler: you’ll need to have measured something common!)
- Resampling the data between the signals to have a common sample rate
- Determining the offset using a “major” event
- The end result of synchronized data
- Analysis techniques to improve the synchronization
- Conclusion
Example of Misaligned Data
Oftentimes in engineering we have data recordings of the same or similar content from two independent sensors and want to align the recordings in order to perform more sophisticated analyses between the two. However, even for two devices configured to have identical sampling rates, minor differences from true sampling rate will occur on each device, and can result in gradual misalignment between samples from these two devices. Devices may also have different internal timestamps at the start of recording due to clock drift, resulting in an initial time offset between recordings. Thus, we want to perform some kind of synchronization on these recordings that accounts for both sampling rate drift and initial clock offsets. The synchronization needs to be both accurate and have a reasonable runtime.
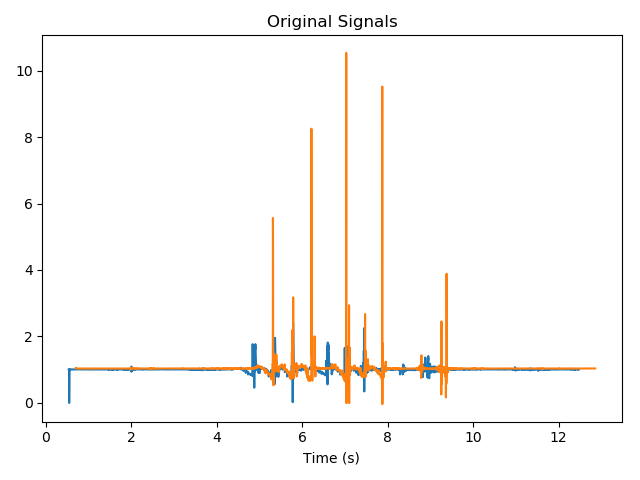
Figure 1: The blue and orange signals were recorded on two separate devices. Their recordings are similar, but one of them is shifted in time, and one of them is misinformed about it’s sampling rate
Device Hardware Requirements
To ensure that the sensors are operating at the sampling rate we think they are, specialized hardware is needed. For every device which is recording data, the device will also produce a sine wave, from which we record samples with a higher rate than our actual sensors. We call this our ‘sync data’ and the signal that produced it our ‘sync signal’.
Resampling for Common Sample Rate
To be able to compare the two signals, they must have a common sampling rate, and so our first task is to resample both signals to a common sampling rate. To accomplish this, we first calculate the ratio of the time spanned by signal one to that of signal two, which we can determine by comparing the frequencies of the sync signals (using Fourier analysis, see graph below). This ratio is then approximated by a rational number, where the numerator is the number of samples desired from signal one’s resampling, and the denominator is the number of samples desired from signal two (see our analysis techniques section below for more details). By following this resampling strategy, the timesteps in the signal’s resampled data will be consistent, and so will their sample rate.
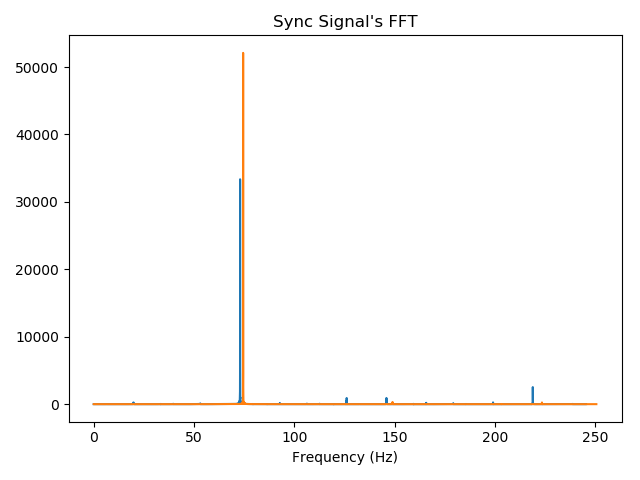
Figure 2: FFTs of the sync data which was saved while recording the misaligned signals
Determining Offset
Now that we have two signals with common sampling rates, we must determine the time offset between the start of the two recordings. This problem can be defined as finding the optimal offset for signal one t∈ ( -len(signal1) , len(signal2))⊆ Z which best synchronizes the resampled signals by some metric. We also allow the user to specify the maximum starting time offset between the two signals to prevent the possibility of a false positive caused by the last few samples in one signal synchronizing well with the first few samples in the other signal.
When synchronizing signals with a large number of samples, the search space for the optimal offset is large, and the computational cost of calculating how in-sync two signals are is high. Intuitively, our approach to avoiding this is to synchronize ‘major’ events within the recordings, because these ‘major’ events should be recorded within both signals, and thus their offset should align the signals. With this in mind, we generate a subset of the search space which is likely to contain the optimal solution. To determine this subset, we take ‘points of interest’ within each signal, and use the offsets which occur when choosing a pair of points (one from each signal) to align the signals. Here we define the ‘points of interest’ to be any peaks or valleys found in the signal.
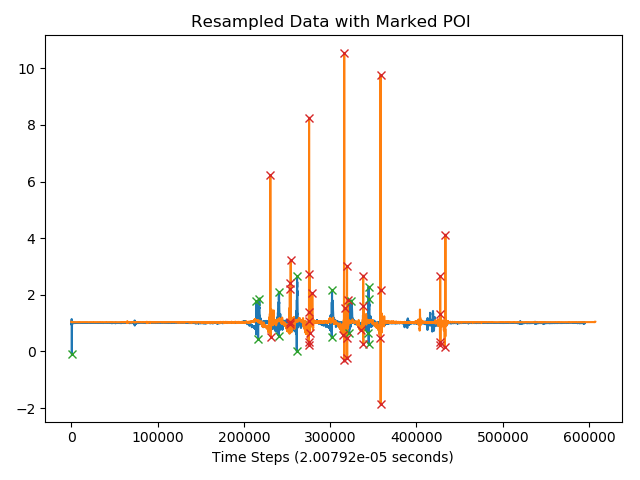
Figure 3: The recordings have been resampled, and had their ‘points of interest’ marked with an ‘X’ on the plot. These points are intended to capture major ‘events’ which would have been recorded in both signals
End Result: Synchronized Data!
The signals are then aligned based on the optimal pair of points of interest, one from each of the two signals. In our case, we chose optimal to mean signals which produce the maximum normalized cross-correlation.
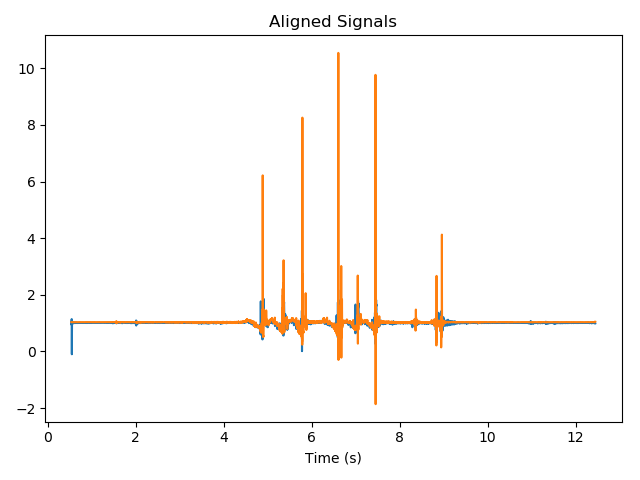
Figure 4: The same signals that are displayed at the start of this post, but now synchronized! Both the problematic time shift and frequency error were handled, and signal’s timestamps adjusted to better represent when the data was recorded
Analysis Methods to Improve the Synchronization
Rational Approximation of Time Spanned Ratio
The rational number which approximates the time spanned ratio between the two signals plays a crucial role in this approach, and is something that could very likely be improved upon. Specifically, it produces the best rational approximation of the time spanned ratio where the denominator is less than 1e6, and greater than 5 times the maximum number of samples in either of the two original signals (to ensure its sufficiently oversampled).
This approach can vary significantly in the number of points used to resample, for very small differences in the time spanned ratio (and the same number of points in the original signal). A more precisely picked rational approximation (through some method like calculating a truncated continued fraction) would likely improve its ability to synchronize the signals.
Synchronization Metric
Normalized Cross-Correlation does a good job of scoring synchronization but is not necessarily the best that can be done. Replacing its use with a more accurate synchronization metric, or even an ensemble metric, would likely improve its ability to identify which synchronization configuration is optimal.
Point of Interest (POI) Finding
Improving the POI-finding method will improve the likelihood that the optimal alignment is found. A less obvious side effect of a more precise POI finding approach is that, by finding fewer false positives, fewer non-optimal POI pairs will be tested for alignment, and as a result the runtime speed will improve.
Conclusion
Hopefully this quick overview helps define how you can go about synchronizing data from two different sensors & data acquisition systems. And to summarize, the major steps are:
- Make sure the two sensors were measuring something common/similar
- Resample the data to be at the same rate
- Find an event of interest for determining offset
As a result of this interest, we are currently working on a tool to help synchronize data between our sensors. Please contact us and let us know if this is something you would like to hear more about!
Related Posts:
- Quaternions for Orientation
- Vibration Analysis: FFT, PSD, and Spectrogram Basics [Free Download]
- Accelerometers: Taking The Guesswork Out of Accelerometer Selection