Tracking Thermal Currents Through My Living Room

0 Comments
Share This
Share This

thermal-currents

During these cold winter months I warm my living room with a gas fireplace, and I've always been curious about how the heat moves through the room. So, since I have the tools (namely, my company's enDAQ sensor, formerly known as Slam Stick), I figured I’d take some recordings, describe my set up, and share what I learned.


The Configuration

Setting up for the data acquisition was pretty simple. To minimize the file size, I really reduced the accelerometer data. I disabled the main accelerometer on the enDAQ sensor, and I put the DC accelerometer at 12 Hz. I left the pressure data enabled because I thought it might show something interesting, and I left the control pad data at 10 Hz. If I ran this test again, I would probably turn off the pressure data and set the control pad data to 1 Hz, to reduce the data a bit.

The next step is to synchronize the devices. Synchronization sets the internal clocks on the devices to the same time, within a few milliseconds, so that we can roughly synchronize data across different devices. The synchronization will drift by up to a few seconds a day, but for a few hours of 10 Hz temperature data it works great.

To synchronize your devices, just:

  • Plug all your devices into the computer
  • Turn on enDAQ Lab (formerly Slam Stick Lab)
  • Go to Devices
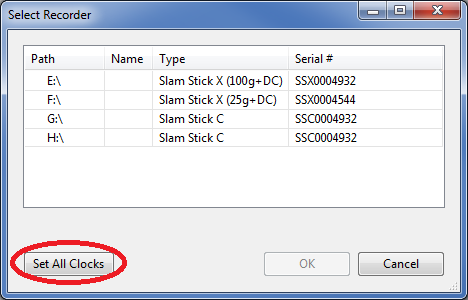
  • Click Set All Clocks

    SetAllClocks

If you configure the devices after you do this, make sure that the ‘Set device clock on exit’ box on the bottom left of the configure screen is disabled, otherwise you’ll overwrite the synchronized time.


The Setup
SS_Heat_Pic

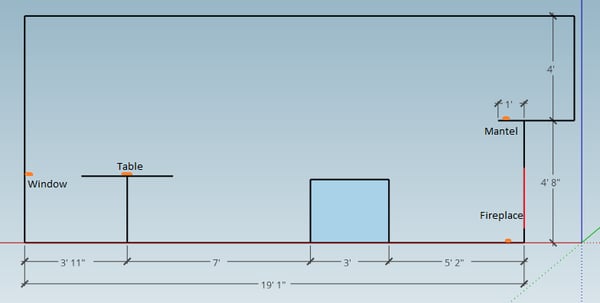
Once the enDAQ sensors are configured, I put them around the living room. I placed everything in a direct line from the fireplace to the back window, as shown in the drawing. The fireplace itself is raised about 8 inches off the floor, and there was one sensor on the floor in front of it, marked Fireplace. Above the fireplace is a nice old mantel that has about a 1 foot overhang. The Mantel sensor went there. The sensor marked Table went on the middle of the table towards the back of the room, past the couch. And the Window sensor is on the far wall, 19 feet from the fireplace.

At 11:27am on Saturday, December 30th, 2017, I started the devices recording, and I let them record for almost 9 hours.

The fireplace has a few modes it can run in. It has a fan which can be on or off, and it has 5 heat levels. Generally, I have it either full on, with the heat at max and the fan on, or I have it on low with the fan off. To make things interesting, I did set the fireplace to a middle setting for a bit.


The Data

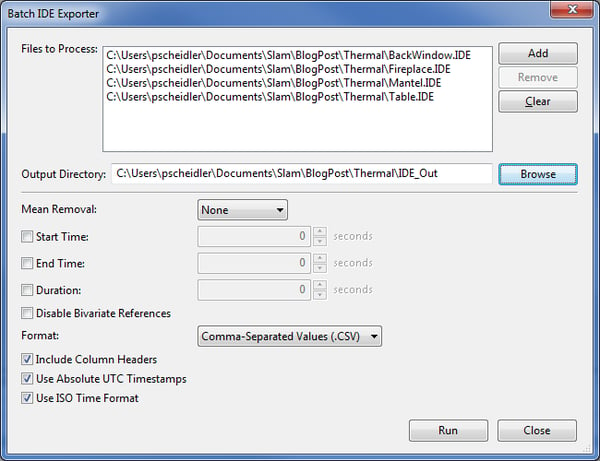
I let the devices record for almost 9 hours, and then went to grab the data. I ended up with a lot of data across multiple devices, so I thought it would be easiest to just export everything into CSV files, and deal with it in Excel. To do this, I copied all the IDE files off the enDAQ sensor, and onto my hard drive. Then I open up enDAQ Lab Software (formerly Slam Stick Lab), but instead of opening an IDE file, I open Tools->Batch IDE Exporter, add my IDE files into the Files to Process box, select .CSV for my format, and check the Include Column Headers, Use Absolute UTC Timestamps, and Use ISO Time Format boxes. Normally, the sample times are relative to the start of that device's acquisition, but checking the Absolute and ISO Format check boxes gives me sample times in seconds since the Unix Epoch of December 31, 1969, which lets me synchronize the data.
BatchExport


The Analysis

LivingroomFireGraph2

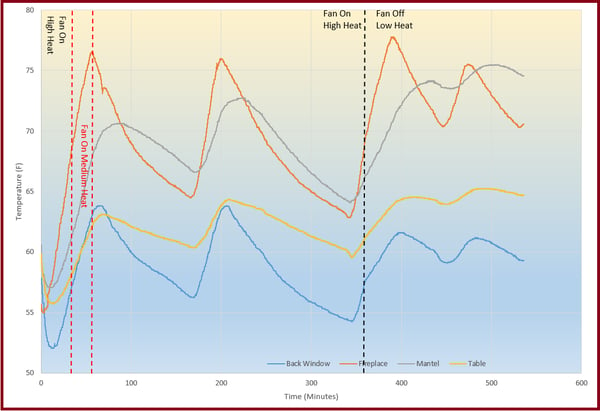
This graph displays the temperature in Fahrenheit. The fireplace temperature is in orange, the mantel is grey, the table is yellow, and the back window is in blue.

Throughout the test, the back window (blue) responds very sharply to the fireplace when the fan is on. In the later tests, I turned the fan off and bring the fire to low, and you can see the temperature slope right at the fireplace heat decreases slightly, but the slope at the back window is reduced most of all. My theory is that with the fan off, the hot air does not have the speed to move to the back wall without first getting soaked into the ambient air in the room.

When the fan is off and the heat is low, the obvious result is that everything heats up less quickly. The interesting thing is that if I turn the fire off after the fan was off, parts of the room keep heating up. What is happening is that the stone hearth around the fireplace, is soaking up more more heat with the fan off, and it keeps radiating heat for a while after the fire is off.

Around minute 70 there’s a weird 2 minute dip in temperature on the fireplace sensor. That’s completely my fault, my wife saw the sensor laying by the fireplace, she did not know I started the test, so she picked it up with her, apparently, cold hands. Just moving the sensor for a moment can have a measurable impact.

At minute 345, there is dip in temperature that mostly impacts the fireplace and table sensors. This was when I came home and opened the door, which is right by the table. The fireplace sensor is about 10 feet from the door, and I believe it was affected because the cold air was moving along the floor, so it really hit the low areas. There are other dips around minute 250 and 440, which should also be from the door opening.

For this project, the enDAQ sensors were definitely overkill - there are much cheaper temperature sensors out there - but at the same time, if you have the tools you might as well use them, you never know what you might find.

For more on this topic, visit our dedicated Environmental Sensors resource page. There you’ll find more blog posts, case studies, webinars, software, and products focused on your environmental testing and analysis needs.


New call-to-action


Share This

Pete Scheidler

Pete has over 15 years of electrical engineering experience, mostly with signal processing and firmware.

Tracking Thermal Currents Through My Living Room

Posted by Pete Scheidler on Feb 15, 2018 3:37:12 PM
Pete Scheidler
Find me on:

thermal-currents

During these cold winter months I warm my living room with a gas fireplace, and I've always been curious about how the heat moves through the room. So, since I have the tools (namely, my company's enDAQ sensor, formerly known as Slam Stick), I figured I’d take some recordings, describe my set up, and share what I learned.


The Configuration

Setting up for the data acquisition was pretty simple. To minimize the file size, I really reduced the accelerometer data. I disabled the main accelerometer on the enDAQ sensor, and I put the DC accelerometer at 12 Hz. I left the pressure data enabled because I thought it might show something interesting, and I left the control pad data at 10 Hz. If I ran this test again, I would probably turn off the pressure data and set the control pad data to 1 Hz, to reduce the data a bit.

The next step is to synchronize the devices. Synchronization sets the internal clocks on the devices to the same time, within a few milliseconds, so that we can roughly synchronize data across different devices. The synchronization will drift by up to a few seconds a day, but for a few hours of 10 Hz temperature data it works great.

To synchronize your devices, just:

  • Plug all your devices into the computer
  • Turn on enDAQ Lab (formerly Slam Stick Lab)
  • Go to Devices
  • Click Set All Clocks

    SetAllClocks

If you configure the devices after you do this, make sure that the ‘Set device clock on exit’ box on the bottom left of the configure screen is disabled, otherwise you’ll overwrite the synchronized time.


The Setup

SS_Heat_Pic

Once the enDAQ sensors are configured, I put them around the living room. I placed everything in a direct line from the fireplace to the back window, as shown in the drawing. The fireplace itself is raised about 8 inches off the floor, and there was one sensor on the floor in front of it, marked Fireplace. Above the fireplace is a nice old mantel that has about a 1 foot overhang. The Mantel sensor went there. The sensor marked Table went on the middle of the table towards the back of the room, past the couch. And the Window sensor is on the far wall, 19 feet from the fireplace.

At 11:27am on Saturday, December 30th, 2017, I started the devices recording, and I let them record for almost 9 hours.

The fireplace has a few modes it can run in. It has a fan which can be on or off, and it has 5 heat levels. Generally, I have it either full on, with the heat at max and the fan on, or I have it on low with the fan off. To make things interesting, I did set the fireplace to a middle setting for a bit.


The Data

I let the devices record for almost 9 hours, and then went to grab the data. I ended up with a lot of data across multiple devices, so I thought it would be easiest to just export everything into CSV files, and deal with it in Excel. To do this, I copied all the IDE files off the enDAQ sensor, and onto my hard drive. Then I open up enDAQ Lab Software (formerly Slam Stick Lab), but instead of opening an IDE file, I open Tools->Batch IDE Exporter, add my IDE files into the Files to Process box, select .CSV for my format, and check the Include Column Headers, Use Absolute UTC Timestamps, and Use ISO Time Format boxes. Normally, the sample times are relative to the start of that device's acquisition, but checking the Absolute and ISO Format check boxes gives me sample times in seconds since the Unix Epoch of December 31, 1969, which lets me synchronize the data.

BatchExport


The Analysis

LivingroomFireGraph2

This graph displays the temperature in Fahrenheit. The fireplace temperature is in orange, the mantel is grey, the table is yellow, and the back window is in blue.

Throughout the test, the back window (blue) responds very sharply to the fireplace when the fan is on. In the later tests, I turned the fan off and bring the fire to low, and you can see the temperature slope right at the fireplace heat decreases slightly, but the slope at the back window is reduced most of all. My theory is that with the fan off, the hot air does not have the speed to move to the back wall without first getting soaked into the ambient air in the room.

When the fan is off and the heat is low, the obvious result is that everything heats up less quickly. The interesting thing is that if I turn the fire off after the fan was off, parts of the room keep heating up. What is happening is that the stone hearth around the fireplace, is soaking up more more heat with the fan off, and it keeps radiating heat for a while after the fire is off.

Around minute 70 there’s a weird 2 minute dip in temperature on the fireplace sensor. That’s completely my fault, my wife saw the sensor laying by the fireplace, she did not know I started the test, so she picked it up with her, apparently, cold hands. Just moving the sensor for a moment can have a measurable impact.

At minute 345, there is dip in temperature that mostly impacts the fireplace and table sensors. This was when I came home and opened the door, which is right by the table. The fireplace sensor is about 10 feet from the door, and I believe it was affected because the cold air was moving along the floor, so it really hit the low areas. There are other dips around minute 250 and 440, which should also be from the door opening.

For this project, the enDAQ sensors were definitely overkill - there are much cheaper temperature sensors out there - but at the same time, if you have the tools you might as well use them, you never know what you might find.

For more on this topic, visit our dedicated Environmental Sensors resource page. There you’ll find more blog posts, case studies, webinars, software, and products focused on your environmental testing and analysis needs.


New call-to-action


Topics: Sensors & Data Acquisition, Environmental Sensors

By signing up you are agreeing to our Privacy Policy