
I was lucky enough to visit the Greater Boston Food Bank, and see how they operate on both their charitable side and their more industrial side. I took some real world vibration measurements from their compressors, and this post describes the basics of how to interpret the data.
I have been a supporter of the Greater Boston Food Bank for years now, and I am always looking for new ways to help them. I first got involved with the GBFB because I am a big fan of food and I think everyone should have some, but the more I learn about them and the fight against hunger in general, the more invested I become. The GBFB does great work for everyone from city children to rural seniors, but I want to talk about a different side of their operation.
Greater Boston Food Bank Operations
The GBFB is a giant storage and transport operation. In 2017, the GBFB sent 60.7 million pounds of food to families and food pantries in 190 cities and towns across eastern Massachusetts. The GBFB is based out of their 117,000 sqft office/warehouse in Boston, where they tend to have 3-5 million pounds of food on hand every day, all ready to be sorted, packaged, and then delivered. The GBFB is a very modern organization, with 120 employees working throughout the organization, 9 trucks making pre-routed, fuel optimized deliveries, and a whole automated wireless system for organizing the warehouse operation.
Condition Monitoring
I am always looking for new ways to help people, and new places to use enDAQ sensors (formerly known as Slam Stick), so I reached out to get a tour of their facility. Along with the huge warehouse they have two refrigerated bays and one freezer bay. These bays are not locked freezers, they are for shorter term storage, so they look just like the rest of the warehouse but with the air conditioning on full blast. This cooling is provided by some heavy duty compressors and heat exchangers up on the roof, and their facilities lead mentioned that any failure there would cause a huge headache.
This is an ideal place to use an enDAQ sensor to do some condition monitoring, where we look at the vibrations on the compressor to determine the health of the unit. I can't share all the data we got, but I am excited to show some of the basics of the setup, and give folks a feel for how this kind of work can be done.
Test Setup
For the setup, I configured the enDAQ sensors to acquire 30 minutes of data at a time. Since this was a test run, I set the acquisition rates to the maximum, but in the end 20 kHz acquisition gave us more data than we needed. On two of the sensors, I connected them to a laptop, and with some new firmware (to be released soon!) I had the laptop start up a new acquisition every 50 minutes. This let the devices charge off of the laptop's power supply, and the laptop could copy the data off the device when it was not acquiring. On the other two, I skipped the new firmware and just had the sensors start themselves every 50 minutes.
To set up the periodic recording on the enDAQ sensor, you just go into the configuration, go to the Triggers tab, and set Recording Delay/Interval to 1200 seconds (20 minutes), set the Recording Time Limit to 1800 seconds (30 minutes), and check the Retrigger box to ensure that the cycle continues. If the device is plugged in to USB for power, you also need to go to the General tab, and set Plug-In Action to Complete recording, or the device will stop recording and appear as a USB drive.

Figure 2: The Greater Boston Foodbank compressor room is shown, where the sensors were mounted.

Figure 3: The sensors were mounted to several rigid locations on the compressor with double sided tape.
Test Results
I took measurements on 3 compressors. In the picture in Figure 3, you can see one sensor mounted on the control box towards the back of the compressor. I used that location on all 3 compressors, but for one of them I also mounted directly on the motor's cover.

Figure 4: Raw data from the compressor mounted sensor. The data was plotted with enDAQ Lab Software.
Above, you can see the raw acceleration data from the sensor mounted on the compressor cover. The vibrations were fairly low, only in the +/- 5g range. This surprised me, since the compressor was visibly and audibly shaking around, but the main frequency was low enough that it could get some real movement without much acceleration. I took some temperature data that showed the casing temperature at 60C. That is pretty warm, but nothing the sensor cannot handle. As you can see from the graph, at around 1200 seconds the compressor went idle. This is a normal part of how they work, and you can see that there was still some motion in it, but it was not going on full power. From the temperature data, it took about 2 minutes for the casing to cool down after the motor went idle.
Frequency Analysis
The really interesting component is in the frequency domain, so let's look at a spectrogram of just the Z axis in Figure 5 and Figure 6.
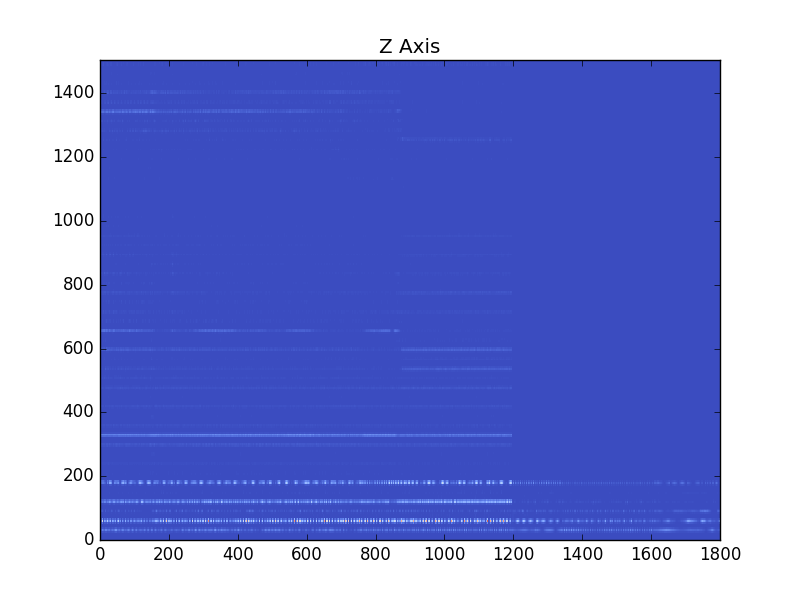 Figure 5: The complete spectrogram of the Z axis data shows the harmonics are present to several hundred Hertz.
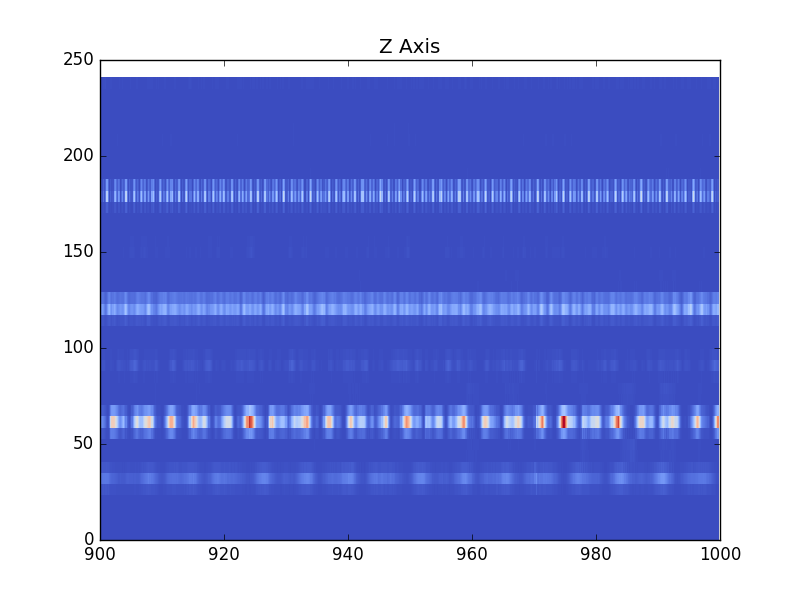 Figure 6: The zoomed in spectrogram of the Z axis data shows a clear dominant frequency at around 60 Hz that is repeated at higher frequencies.
We can faintly see that the spectrogram has a fundamental around 30 Hz, with a lot of harmonics, most clearly around 60 Hz. The 30 Hz frequency corresponds to 1800 rpm, which is a common compressor frequency. In this and other spectrograms, we see a lot of harmonics at both even and odd multiples of the fundamental. That tends to mean we are looking at an asymetric function, like a skewed triangle wave or a square wave with a duty cycle that is not 50/50. The pistons should have more force going in one direction, so that makes sense. The spectrogram also shows what looks like a very low frequency inside the harmonic data, where it comes and goes at something around 1 Hz. This could correspond to a system control frequency, or it could be related to the fluid moving through the compressor.
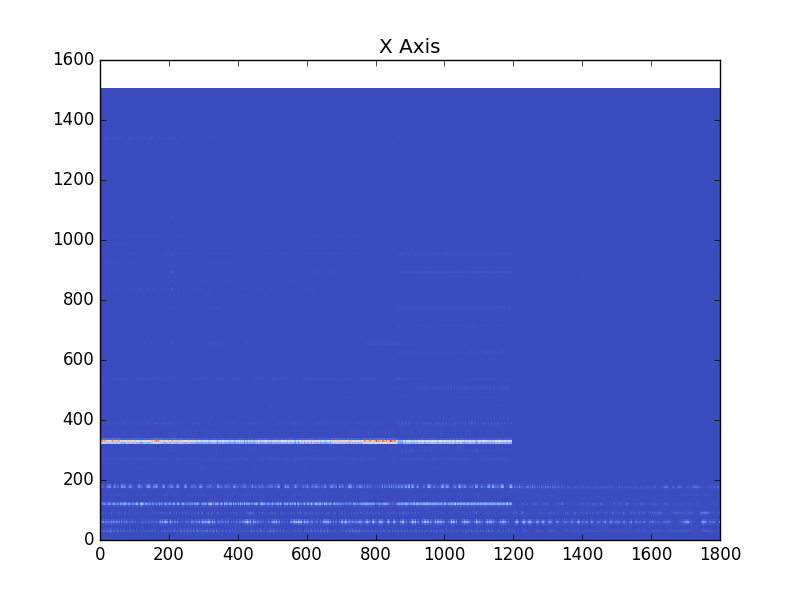
Figure 7: The spectrogram of the X axis data shows a clear dominant frequency at closer to 360 Hz which may be a structural resonance of the motor or mounting.
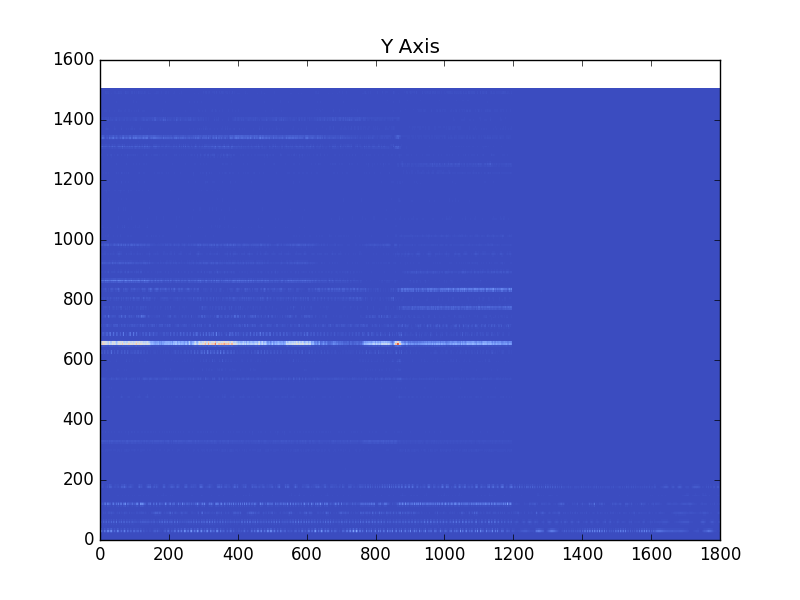
Figure 8: The spectrogram of the Y axis data shows a strong resonance around 660 Hz, and notable amplitudes at higher frequencies. Again, this is probably caused by the structural modes.
Figure 7 and Figure 8 show spectrograms of the X and Y axes from the same device. All the frequencies are multiples of 30 Hz, but we see some very different harmonics emphasized. What is happening is that the system is being driven at 30 Hz, and then the harmonics are amplified or attenuated unevenly. This is caused by the various elements of the system. For example, the sensor is mounted on a raised cover, which might be acting like a cantilever, and amplifying some of the harmonics around 660 Hz. Another option is that the sensor may be tapping against the nearby bolt, or it may be acting like a cantilever on its own, since it is attached to a hot, uneven surface with adhesive tape, so that tape can act as a bit of a spring. Inside the compressor, there could be all sorts of more subtle factors influencing the different harmonics.
Conclusion
Determining what harmonics to pay attention to is going to be key to any condition detection algorithm. The different couplings that amplify or attenuate different harmonics are not necessarily noise, they reflect the internal state of the system. With more research, we hope to be able to help engineers evaluate their oil viscosity or bearings or gaskets, by showing them how the excitation frequencies are coupling through these elements.
For more on this topic, visit our dedicated Wireless Vibration Monitoring Systems resource page. There you’ll find more blog posts, case studies, webinars, software, and products focused on your condition monitoring and maintenance needs.
Download These Free Scripts (57MB zip)
Download the scripts used and analyzed in this post.