 Wind Turbines have revolutionized available energy sources and are now the first alternative to traditional power sources (i.e. gas and steam turbine). They are becoming a considerable section of the world market and, in certain countries, their contribution is above 30% of the country's needs.
In addition to their market growth, their physical size has also increased considerably over the last decade and the next short-term target for turbine dimensions seems to be the 10 MW turbine with 115-meter blades.
Although the increased turbine size has considerably reduced the cost of energy per megawatt (MW), maintaining them remains costly and seems to be the only deterrent to further price reduction. In fact, the increase in size has shortened the life cycle of some of the turbine components. Some components, such as the main shaft axial thrust bearing, are being replaced after a certain number of hours despite its condition given the high probability of failure and the costs and consequences that would follow.
This blog, while quite technical, evaluates the feasibility of using a standalone data acquisition device like our enDAQ sensors to aid in wind turbine health monitoring as an alternative to traditional approaches such as strain gauges and embedded optical fibers.
In addition to the main shaft axial thrust bearing, another important component that is experiencing a high rate of failure is the planetary gearbox that connects the blade shaft to the generator. The cost of replacing a gearbox can be prohibitive and the latest trend in research is to develop a shaft train that does not use a gearbox. However, this seems a very challenging target, especially when measured with costs, and at the moment, the majority of turbines have a gear and it’s most likely a planetary one.
The main contribution to these component failures is the high level of vibrations that these long blades are experiencing. In fact, imagine what the variability of the wind conditions is along the blade (long) span where there are wind speed changes, wind direction changes, gusts and turbulence from the turbine ahead, etc. The real-time monitoring of the blade vibrations and consequent modification of the blade asset (mainly pitch angle) seems to be the only effective choice in order to mitigate vibration loading and increase the structural life of turbine components.
Another important aspect of measuring blade strain at the root is that its bending moment thus reconstructed will be proportional to the wind shear that blades will “feel” during their rotation, as shown in Figure 1. This important outcome of blade root strain measurement can be used (in principle) from the control system of the turbine to better optimize the power output. In fact, the wind measurement of the control system is based on an anemometer placed on the hub and therefore an eventual wind shear would be completely unseen. It has been estimated that better knowledge of wind profiles could lead up to a 4% increase of power.
This increase in power production has attracted great attention in the last decade or so especially because of the increase of turbine size and, therefore, power production. For example, 4% increase of a 7 MW turbine would bring a considerable increase of 280 kW. The trend nowadays for estimating a better wind profile is to try to reconstruct its shape at least 50 meters ahead of the turbine by using Lidars on the top of each turbine. Lidars are complex and costly hardware and since the size of the turbine is getting bigger and bigger, so are the size of the Lidars and would require considerable high power to function (see Figure 2).
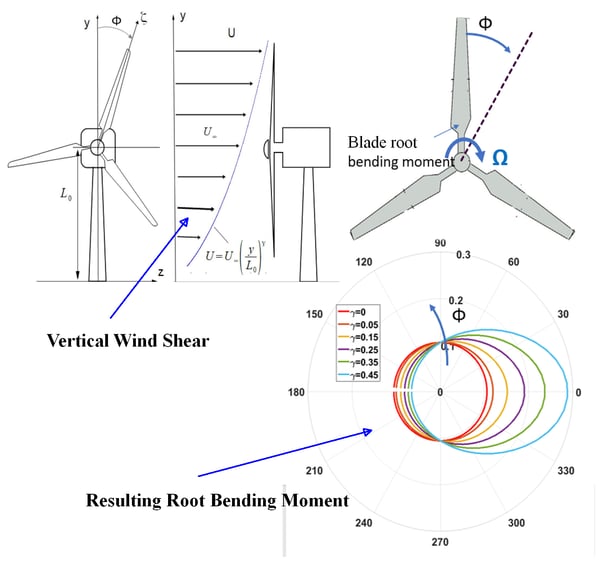
Figure 1. Effect of vertical wind shear on the blade bending moment measured at the root of the blade
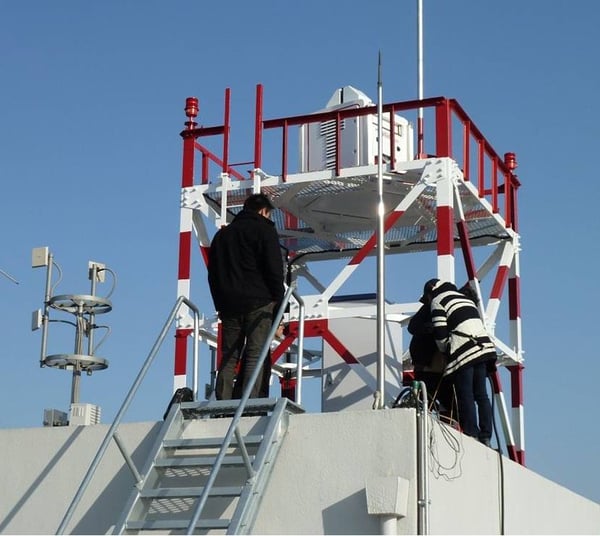
Figure 2. Example of Lidar mounted on the hub of a wind turbine
It is a common belief that the root bending moment measurement would be a simpler way to estimate wind conditions. Because of the blade rotation, the bending moment, and so the wind conditions, can be updated at the shaft speed and, since there are three blades, this information would be updated 3 times per revolution.
However, to-date, the conditioning monitoring of wind turbine is only taken at the main shaft and at the tower level. Strain gauges for blade monitoring are seen as a very unreliable method especially when turbines operate in extreme conditions and strain gauges can, unfortunately, fail very easily. On the other hand, fiber-embedded strain gauges have been produced in blades, but the complexity of transmitting data from the rotating blades into a stator using slip-ring or similar methods, have prevented their divulgation.
Our project started in the summer of 2019 and the target was to look at alternatives to strain gauge measurements. Precisely, we were looking at obtaining similar information of what strain gauges would provide using one of our products, the enDAQ sensor (formerly known as Slam Stick). The enDAQ sensor is a standalone data acquisition device with an embedded tri-axes accelerometer, a gyroscope system and a pressure and temperature sensor. It is battery powered, rechargeable and logs the data internally, although we are extending its capabilities with wireless transmission. In this capacity, we have just completed a pilot project with NASA and have delivered the first prototype that transmits data wirelessly over a relatively long distance.
The theoretical challenge with this project was to understand the feasibility of reconstructing strain data from the blade when measuring the acceleration at the blade tip. In theory this is possible when the blade stiffness is well known and the blade itself has a zero-reset error point (in this case zero displacement at the root-cantilever beam). Theory, however, faces reality and high blade flexibility in an aerodynamic field that can be highly variable and may not be able to give expected results.
Bending stress for wind turbine blades in the rotating frames
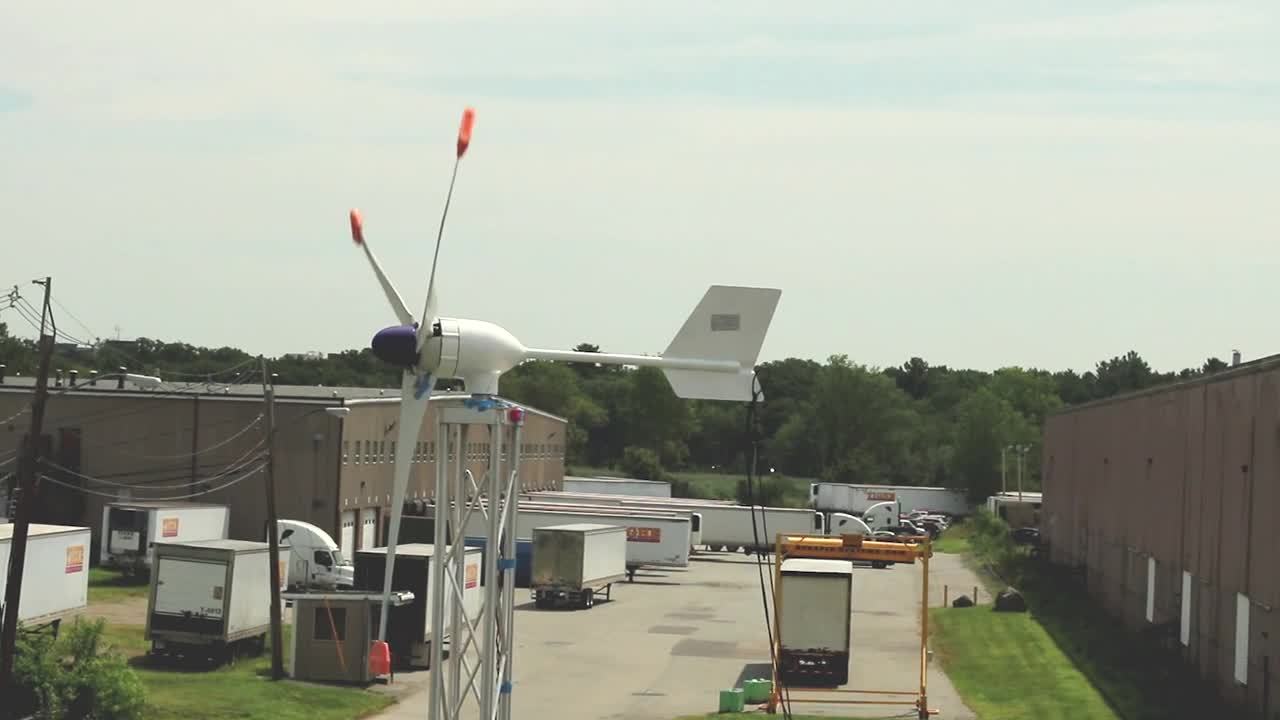
A small wind turbine of 700 Watt max power output was purchased and installed in our facility on top of a 20 ft tower. The blade dimensions are approximately 36" (920 mm) long, tapered with a 5" (125 mm) width at the root.
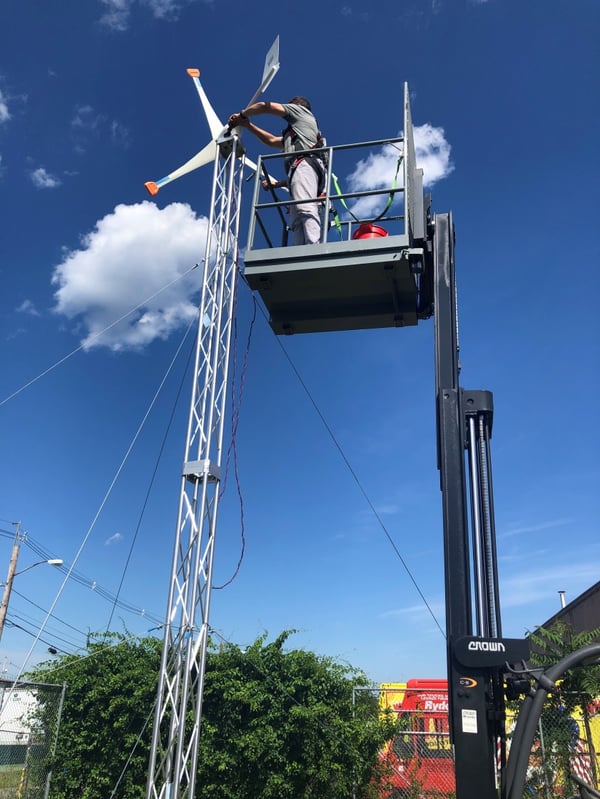
Figure 3. Small instrumented wind turbine mounted on a 20 ft tower
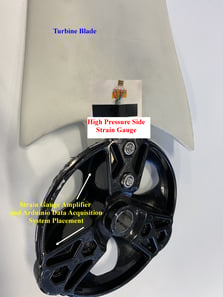
Two strain gauges, one on the low pressure and one on the high pressure side, were placed at the blade root and the sensor was secured on the tip of the same blade with strain gauges by using an appropriate designed 3D printed fixture bolted to the tip of the blade (see Figure 4). Although only one sensor was used, an equivalent weight was placed in the remaining two blades for balance purposes. We used two Wheatstone bridge strain gauge configurations on the opposite sides of the blade amplified with an in-house modified Hemobillo strain gauge amplifier. The strain data from the two amplifiers were acquired with an Arduino system programmed to write onto a SD card. The entire electronics, including the rechargeable battery had a volume of approximately 2 cubic inches and fit well inside the turbine nose. The sensor was synchronized with the strain gauge reading with a small, manually impacted shock on the blade after they were both turned on.
| a) | b) | c) |

|
|
|
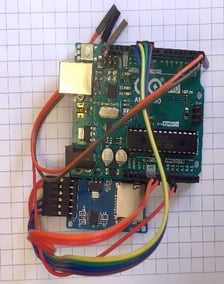
Figure 4. a) 3D printed fixture for slam stick placement to the tip of the blade, b) high pressure side strain gauge placed at the blade root, c) Arduino data acquisition system with SD card writer
Both the strain gauge and the sensor were set to record approximately 20 hours worth of data. The strain gauges on the blade were calibrated with different sets of weights and blade displacements were also recorded in several blade points. The tip displacements of the blade where slightly nonlinear (see Figure 6) although its tapered shape and the twist angle would suggest a stronger non-linearity with loads.
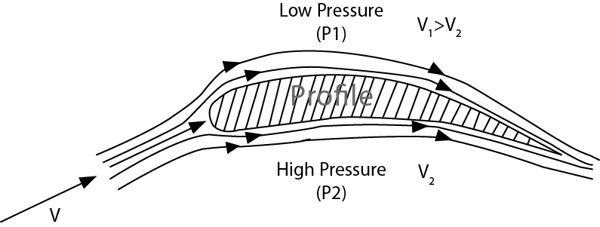
Figure 5. Flow and pressure distribution around a blade profile
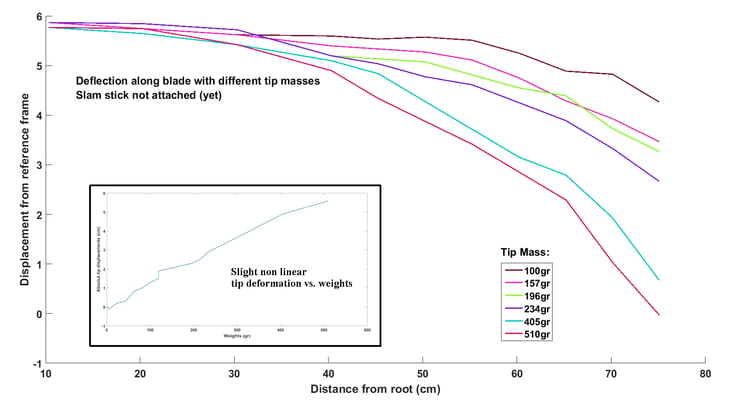
Figure 6. Blade deflections (cm) at different tip loading (weights) – No slam stick attached
As stated, the blade also has a twist angle of approximately 12 deg from root to tip and therefore the bending under distributed load is coupled with torsion. However, at least for this project, we neglected the twist due to lift and drag developed in the blade profile and concentrated entirely on bending. Future developments will include all effects.
The strains obtained from the low pressure and high pressure sides of the strain gauges are shown in Figure 7 (red and blue). The two strain gauges voltage is symmetric with respect to the horizontal axis since during bending the opposite side of the blade will experience opposite strain fields (tension and compression). Since the blade is also subjected to axial forces due to centripetal acceleration, by removing the bending strains (i.e. by subtracting the low-pressure side from the high-pressure side strains), one obtains the axial strains (magenta in the figure). Of course, in order to obtain the equivalent moments, one needs to calibrate a priori the strain gauges. The sinusoidal behavior of the voltage from the strain gauges happens because the blade weight will change direction during the blade rotation. Therefore, from this data, the turbine speed can be estimated with high precision.

Figure 7. Voltage obtained from low pressure and high pressure strain gauges with corresponding average axial strains obtained subtracting low pressure from high pressure strains
Similar behavior can be seen from the acceleration data of our sensor tri-axis accelerometer as shown in Figure 8. The sinusoidal behavior of the data is still due to the gravity vector which changes direction in the rotating reference frame. Therefore, with the sensor, it is easy to estimate the turbine rotation speed with some accuracy. As expected, in Figure 8 we see how axial acceleration (y-direction) is more sensitive to speed variations since it is proportional to the square of rotational speed (a_T=〖-ω〗^2 R). The turbine speed can be conveniently estimated by the square root of the axial acceleration (absolute value) divided by the distance of the accelerometer form the rotation axis. Of course, there will be oscillation due to the effect of gravity on the rotating reference frame and, not to underestimate, the effect of noise in the data.
Strain and acceleration data well follow the blade deformation as is shown in Figure 9 and therefore we strongly believe that, with opportune calibration, the two sets of data can reproduce the same information on structural stresses.
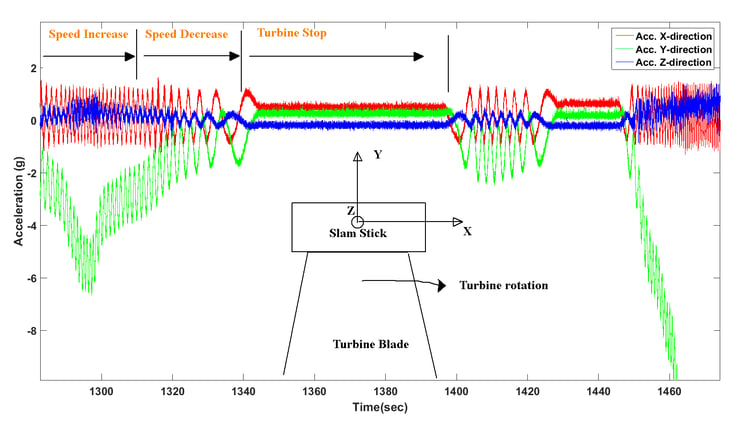
Figure 8. Acceleration data from the slam stick alongside with a schematic of the slam stick reference frame position on the tip of the blade
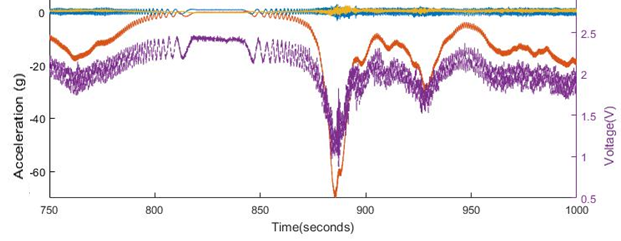
Figure 9. Strain vs. acceleration data
Torsional Excitations
In the previous section we discussed the results obtained from bending excitations of the blade due mainly to wind and centrifugal forces. Another interesting application of the enDAQ sensor, however, is for estimating torsional vibrations of the turbine axis. To date, there are very few sensors that can be used as torsional monitoring. Encoders are essentially the only reasonable ones, although there are a lot of drawbacks to installing encoders as permanent monitoring systems. One of the most common ways of measuring torque in a wind turbine is to measure the current from the generator with an inductive probe. Current for these generators is directly proportional (in theory) to torque and the control system has one of its critical measurements based on this method. However, although it is a very efficient and easy solution for torque measurements, since torsional vibrations can be of a different order of magnitudes, its resolution is not as good for obtaining precise torsional vibration. In fact, the current generated in a turbine can be of several kiloampere (kA) and, therefore, small variations can be embedded in the noise level of the signal. On the other hand, by placing an accelerometer on the tip of the blade, one can actually amplify the effect of torsional vibrations and therefore estimate its content better. However, this could be exactly true if the blades were rigid, but their flexibility makes things a little more complicated (anyway possible) and the blade dynamics needs to be accounted for.
The data collected during our runs showed some interesting torsional mode shape excitation that would have been impossible to detect with the strain gauges. As shown in Figure 10, the x-direction acceleration (torsional - see schematic of enDAQ sensor mounting frame in Figure 8) showed several events in which some very strong torsional excitation was induced. We saw that the excitations always happened when the rotational speed was in the vicinity of 11 Hz. Unfortunately, we do not have a rotordynamic model of the turbine to verify the torsional mode shape excited, but the measurements were very consistent, and the excitation can be seen every time the speed reached this value. Another interesting aspect of these events was that the event itself would prevent the turbine to pass this speed and instead slowdown. It could have been some mechanical or electrical stop placed by the manufacturer to prevent turbine damage, but we could not have any information from the manufacturer.
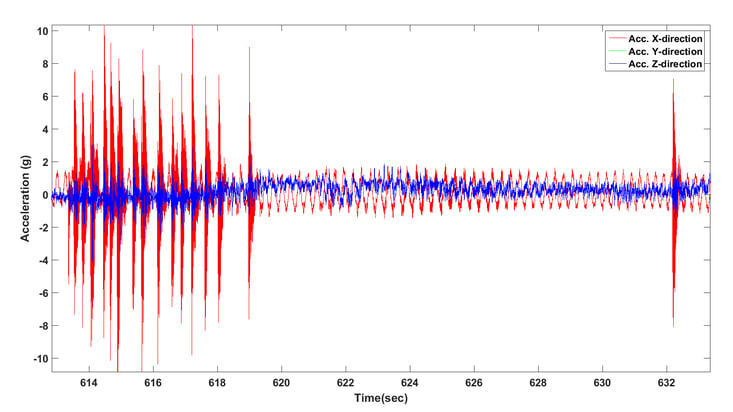
Figure 10. Torsional excitations excited by the high speed of the wind turbine
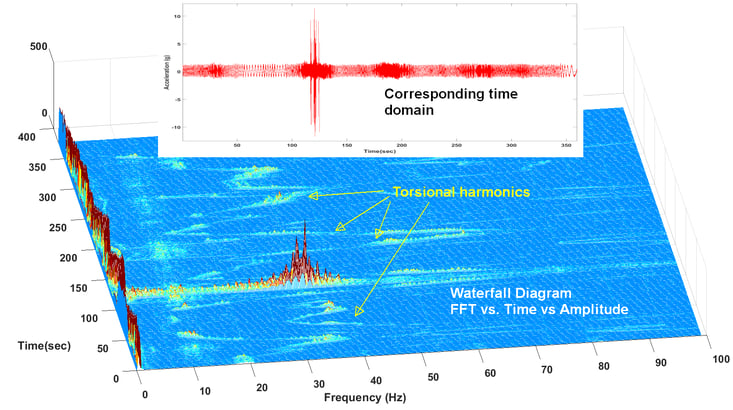
Figure 11. Waterfall diagram compared vs. time domain data of one of the torsional events registered with the slam stick
By taking a waterfall diagram of one of these isolated events (i.e. fft analyses of data at different times), as shown in Figure 11, the event (position) and magnitude can be seen clearly. In addition, the waterfall diagram showed a surprising number of other torsional harmonics, unexpected, but clearly detected by the x-axis accelerometer of the slam stick. These torsional vibrations might come from different sources. The two main sources are the turbine torsional mode shapes and the converter attached to the generator. In fact, it is well known that converters introduce high frequency harmonics into the shaft torsion through the generator. We are still investigating this data, and we recognize the value that an accelerometer placed on the tip of the blade can have in order to have a complete understanding of the entire wind turbine vibration.
Conclusions
The vibration monitoring of wind turbines could benefit from blade monitoring. However, available sensors such as strain gauges and embedded optical fibers are a method that can be either unreliable or too complicated to be included in a state-of-the-art monitoring system. With this project we tested the feasibility of an alternative measuring system by using a tri-axes accelerometer placed on the blade tip. We valued the capability of our enDAQ sensor device, which is a self-standing data acquisition system and all the main features of the turbine vibrations were easily captured. We also explored unpredicted capabilities of this method and we are investigating it further.
The future of this method greatly relies on the easiness of retrieving data and the placement of the device in the turbine blades. We firmly believe that our current product with our planned development of a long-range wireless transmitting function and self-powered system, for which we have already developed some prototypes, will create a leap in wind turbine monitoring capabilities.
We are also pleased with the feedback received so far for one of our units used by means of comparison for traditional accelerometers in the structural health monitoring of the only offshore wind turbine in the USA, which is in Rhode Island. The project is run from Tufts University, with whom we are establishing a strong relationship. Unfortunately, the data from the sensor used neither can be shared with the investigator nor, of course, displayed, but for us is a first step to bring a non-conventional device into the complex world of wind turbine health monitoring.
For more on this topic, visit our dedicated Wireless Vibration Monitoring Systems resource page. There you’ll find more blog posts, case studies, webinars, software, and products focused on your condition monitoring and maintenance needs.